|
|
The features on this page require a GENESIS64 Advanced license and are not available with GENESIS64 Basic SCADA . |

![]()
|
|
The features on this page require a GENESIS64 Advanced license and are not available with GENESIS64 Basic SCADA . |
![]()
Energy AnalytiX is an analytics data-driven application for Energy Management. It operates by collecting data from various data sources (real time, historical, Web services-based, external, etc.) and then utilizes the collected data in evaluating user-defined energy calculations.
This topic provides an introduction on how to utilize the sample energy dashboard. The key idea of the sample energy dashboard is to provide a quick start and an example of how to create energy visualization using a data model and HTML5 based visualization.
Note: This help page is intended to be a guide primarily for planning purposes and to give you an understanding of the recommended sequence of steps for efficiently deploying your Energy AnalytiX application. For more details about any step mentioned herein please consult the help documentation as well as other available help pages.
Energy AnalytiX integrates a number of ICONICS key technologies in order to provide an energy management solution, including:
Asset AnalytiX
Hyper Historian
AnalytiX-BI
KPIWorX-BI
Triggers
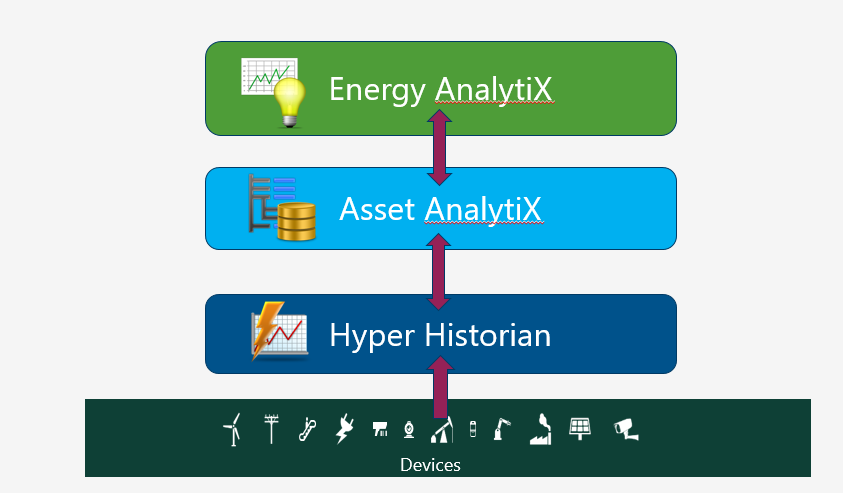
Energy AnalytiX is deployed using the AssetWorX infrastructure and the Asset AnalytiX support for mapping equipment properties to Hyper Historian tags and calculations. Thus, an end user can add energy functionality to any asset using the Energy AnalytiX extension in the Workbench.
High Level Architecture of Energy AnalytiX
For more information, refer to Energy AnalytiX Quick Start.
The newly updated energy dashboard is quite compatible with the previous releases with the following differences:
Energy data models
New parameterized views were added
Asset level metadata were removed from the EnergyAssetsDim dataflow
Asset level metadata were removed from the EnergyAssetsDimBI data tables from all energy data models
EnergyConsumptionFlowsView was removed from the Long term analysis energy data model
Energy dashboards
Consumption Flows dashboard was removed from the Long Term analysis folder
Important notes:
The updated Workbench Desktop package will overwrite any existing energy data models and energy dashboards.
If the user has manually modified a prior released energy data models and energy dashboards, he should not install the updated Workbench Desktop package on the same project, but rather create a new project temporarily and review updates for the latest release.
Energy AnalytiX product installation will install an energy dashboard for the end user to utilize as a starting point for providing visualization for the energy application.
The energy dashboard is developed to be a general-purpose energy application visualization tool and it will require customization from the end user to make it specific to the end user’s application. For example, if the target energy application does not involve say Carbon-based analysis, then the default energy dashboard will need to be customized to exclude carbon-based visualization.
The energy dashboard consists of three main components
Energy Data Model
Implemented in AnalytiX-BI
Energy Data Model Triggers
Implemented in Actions\Date and Time triggers
Energy Visualization Dashboard
Implemented in KPIWorX-BI
Both the energy data model and the energy dashboard are developed in a generic way and they accommodate all possible data that an energy application may include. They are also developed in a way to automatically update with newer data, on different periodic intervals, based on the estimated frequency of changes in the underlying data.
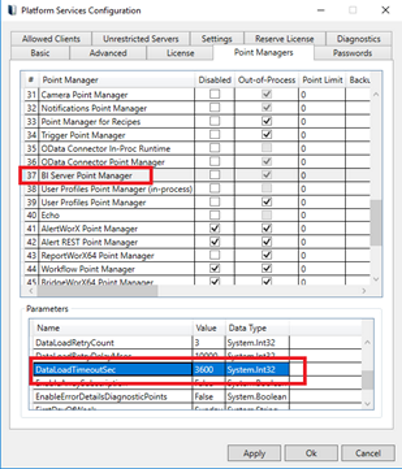
Energy data can include data spanning significant time intervals or a high volume of energy calculations. Therefore, prior to deploying the energy data models or using them, it is advised that the end user sets the data load timeout interval to a high value in the AnalytiX-BI point manager, like 3600 seconds.
AnalytiX-BI Point Manager Settings
This refers to the process of deployment of the AnalytiX-BI Energy data model and related energy dashboard implemented in KPIWorX. The energy dashboard requires three areas to be available so that it can work.
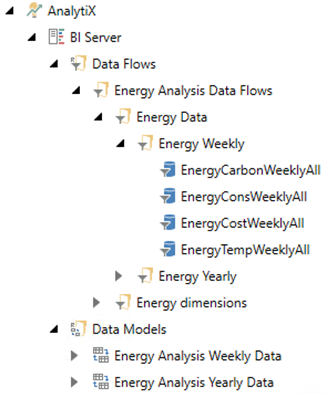
Energy Data Models in AnalytiX-BI
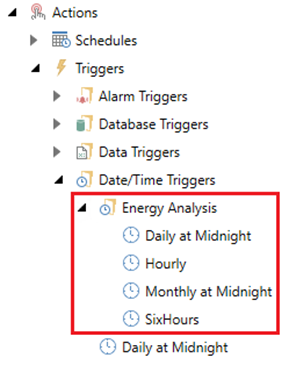
Triggers Related to Energy Data Models
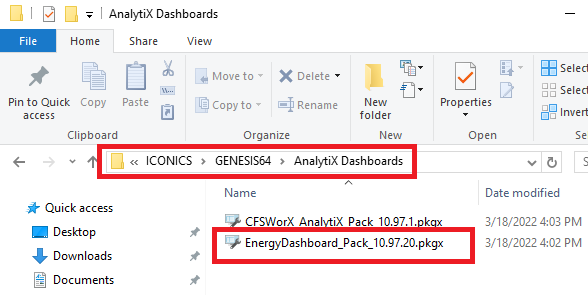
For the new Energy AnalytiX there will be a new Workbench project pack file, which the end user will have to un-pack manually. This pack file can be located under Program Files > ICONICS > GENESIS64 > AnalytiX Dashboards and is called EnergyDashboard_Pack_version.pkgx.
Important Note:
If you have unpacked a previous version of the pack file containing the energy dashboard and data model, the newer version will overwrite any previously existing energy dashboards and data models.
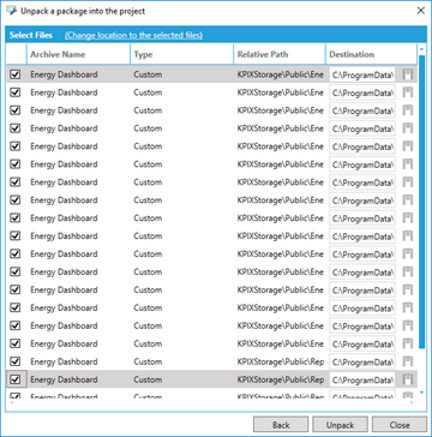
The end user will have to unpack this file. While unpacking, the user should check all the related KPIWorX files.
Related KPIWorX-BI Dashboard Files
Energy Dashboard KPIWorX-BI Dashboard Files
After the energy dashboard is successfully unpacked, the end user should perform the following actions:
Restart AnalytiX-BI point manager.
Verify that the following are completed successfully
AnalytiX-BI data flows and data models are unpacked
Triggers related to the energy data model are unpacked
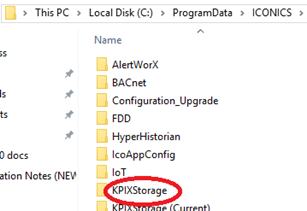
Energy dashboard files are unpacked under C:\ProgramData\ICONICS\KPIXStorage\Public
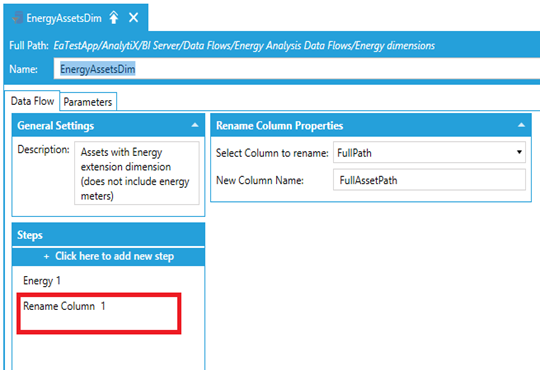
Open AnalytiX > BI Server > Data Flows > Energy Analysis Data Flows > Energy dimensions > EnergyAssetsDim and check the following:
o If any errors are displayed under the Rename Column step, delete the step, click Apply and then manually re-add the step
o Restart AnalytiX-BI point manager
o Restart IIS
o This issue may appear when for certain asset structures which are much different than the sample one used for creating the energy data model
Rename Column Step in EnergyAssetsDim dimension
The sample energy dashboard was developed on a sample energy application used as a showcase of the product functionality. The end user energy application maybe different than the one utilized in developing the sample energy dashboard and as a result in some cases no data maybe displayed at the energy dashboards. First of all, if no corresponding energy functions are configured, then the related energy dashboard visuals will display no data.
For example, if no carbon calculations are defined, then the related carbon visuals will display no data.
To troubleshoot the scenario where no data are displayed in the energy dashboard, when all related energy calculations and functionality are defined,, a few troubleshooting steps can be utilized.
The sample energy dashboards store within the dashboard file the current data filter selection. It is quite possible that the related data filters in an end user’s application may have different values than the target application filters. In this case, choosing a different data filter selection in the dashboard should display the existing energy data.
If I examine my data models in AnalytiX-BI, the EnergyAssetsDimBi table under the any of the three energy data models is showing with an "error" status.
This issue can happen if the AssetWorX hierarchy is not set up in a way consistent with the data model. To resolve this, make the following changes to the AssetWorX configuration:
Add the Energy AnalytiX extension to the topmost equipment under Assets > Equipment, if it is not already present.
Ensure that each equipment which has the Energy AnalytiX extension is configured with one of the following levels: Enterprise, Area, or Site. The level is configured on the General tab.
Once your AssetWorX configuration meets the above requirements, follow these steps:
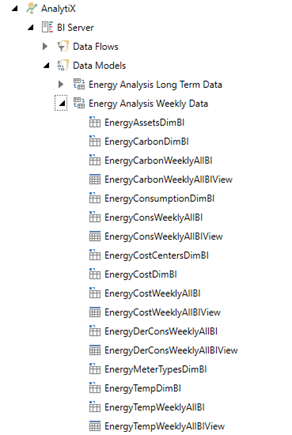
Expand AnalytiX > BI Server > Data Models.
Expand one of these models: Energy Analysis Yearly Data, Energy Analysis Weekly Data, or Energy Analysis Long Term Data.
Edit the EnergyAssetsDimBi table.
Scroll to the Runtime Status section and select Drop and Reload Table Data.
Wait for the Last Updated time to refresh.
If the status says “Online”, the problem should be resolved. If the status still says “Error”, continue with the next steps.
Edit AnalytiX > BI Server > Data Flows Energy Analysis Data Flows > Energy Dimensions > EnergyAssetsDim.
Select the Energy step.
Select Apply Changes for that step.
Select the Rename Column step.
Select Apply Changes for that step.
Select Apply for the whole data flow.
Go back to the EnergyAssetsDimBi table and do another Drop and Reload Table Data. The status should change to “Online”. Repeat for each EnergyAssetsDimBi table in the Energy Analysis Yearly Data, Energy Analysis Weekly Data, or Energy Analysis Long Term Data models.
The energy data models, implemented in AnalytiX-BI, include all the reference data (dimension data) as well as all the energy data (fact data) and data relationships to model the energy application and to facilitate advanced energy data analysis and visualization.
The energy data model addresses the following time ranges of energy data:
The energy data model addresses the following time ranges of energy data:
In more detail, the energy data model consists of:
· Data flows
o Energy data ETL steps to enrich energy data with metadata
· Data tables
o Energy data containers
· Data Views
o Views based on data tables focusing on customized energy data representation
o We now support parameterized views for easier integration to visual clients
· Data Relationships
o Relationships between energy data (fact data) and reference data (dimension data)
Regarding the time span that we collect the data for, the energy data model consists of:
· Weekly data
o Energy data for the last 7 calendar days by hour
· Yearly data
o Energy data for the last (3) calendar years by day
· Long term analysis data
o Energy data for the last (3) years by day
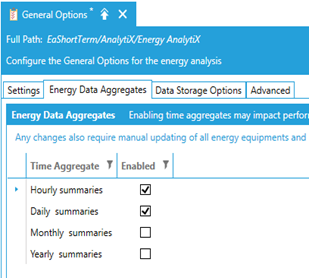
o Require daily data aggregates option enabled in Energy AnalytiX General Options\Data Aggregate Options
We have just adjusted the default data time range interval for the energy data model to reflect an integral rolling interval of say, 1 week, 1 year or 3 years. This rolling time interval takes into account full calendar months as well.
For example:
Consider the yearly model. By default, if say today's date is 1/26/2022 (today's date), the default time range for data in the yearly interval will be from 1/1/2021 to 1/26/2022 (today's date) to reflect an integral number of calendar months.
Data Aggregates in Workbench
The energy analysis data model consists of two basic groups of data
Dimension data
Reference data, metadata such as asset names, meter types, calendar dates
Fact data
Actual energy data such as consumption or cost data
The Energy Data Model is implemented inside AnalytiX-BI as a collection of:
Data Flows
Data Tables
Data Views
Relationships
Incremental data refresh periodic triggers
Data Models grouped by data range of time
Parametrized views
The energy data model has support for parameterized views, which allow for a parameterized API that clients like GridWorX64 can utilize
In more details, new parameterized views were added at all data models to process data based on the time and data resolution of each energy data model.
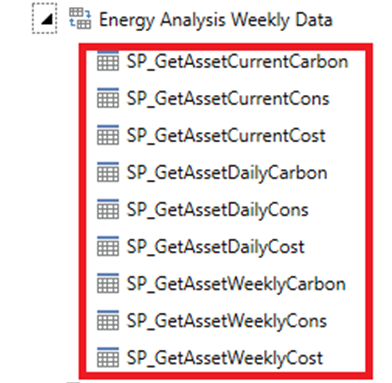
All parameterized views are commented and they do include comments regarding their parameters
They can be executed by supplying values for the parameters
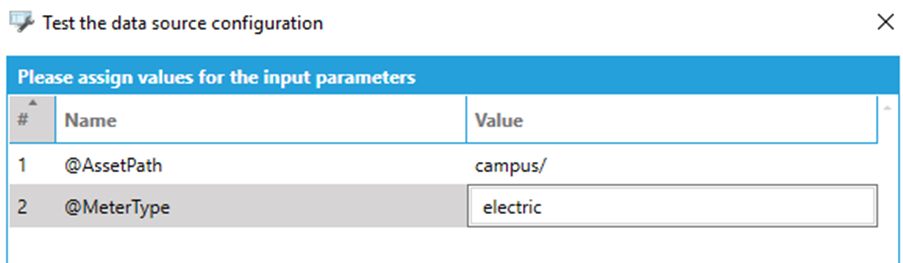
and the results can be viewed inside WBD
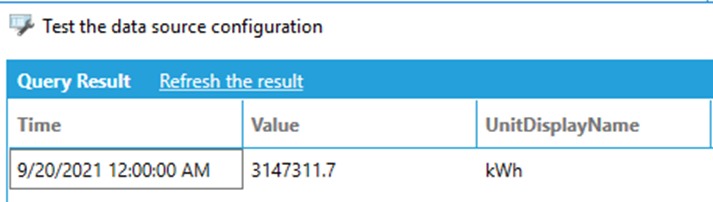
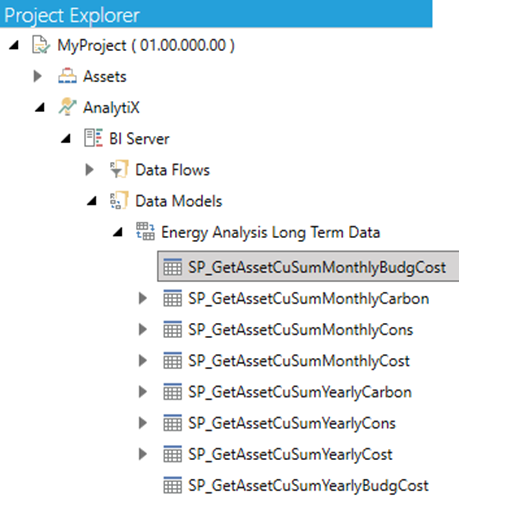
In addition, the Long term analysis energy data model includes newly added parameterized views for calculating the CuSum consumption, Cost or Carbon data of an energy asset. Specifically, we have added support in the Long term Analysis data model in the form of parameterized views which will produce yearly and monthly CuSum totals fort consumption, cost and carbon.
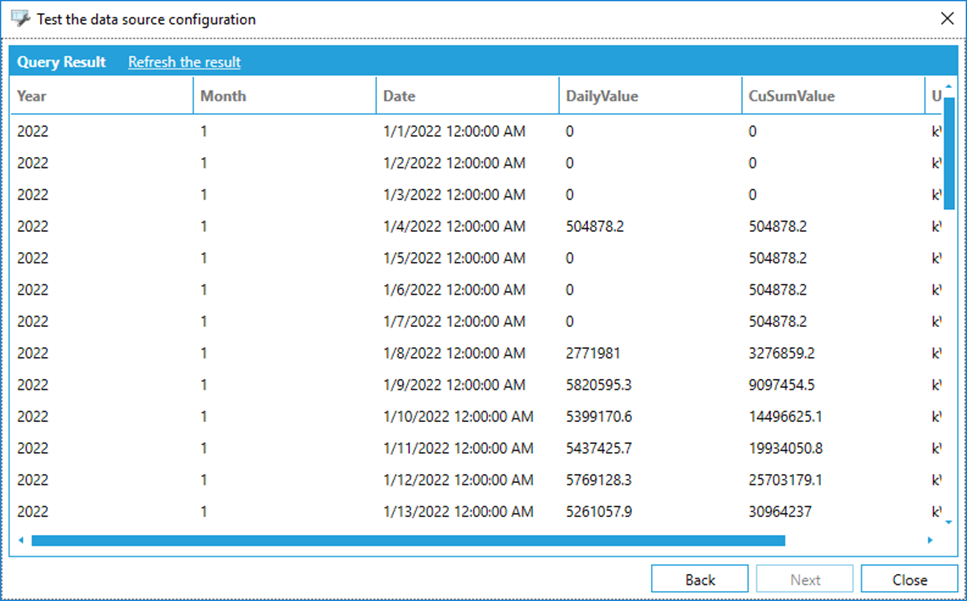
The newly added parameterized views will return both the daily values as well as the CuSum values:
Important note:
The accuracy of the energy data in the parameterized views strongly depends on the energy data model’s trigger-based data update mechanism and the caching of data in AnalytiX-BI
Weekly data model
Updates every 1 hour (plus delay)
Uses base summary aggregates
Yearly data model
Updates every 1 day (plus delay)
Uses base summary aggregates
Long term data model
Updates every 1 day (plus delay)
Uses daily data aggregates
As an example, consider the Long term energy data model. On say September 12th latest data will be from September 11th 12:00 AM - September 12th 12:00 AM. The end user can make the related energy data model update triggers to update with new data say every 1 hour, however this could increase the load on AssetWorX, Hyper Historian and AnalytiX-BI servers.
Energy Data Model
The Energy Analysis Data Model is a generic data model and most likely end users will have to customize it. Editing the default energy data model needs to be planned carefully and with an understanding of the required steps.
Note: It is recommended that prior to any modification of the Energy Data Model, the related configuration database is backed up.
Next, the type of editing in the data model has to be reviewed with respect to data model entities relationship and parent child hierarchies. It is best if we provide a few examples of how to accomplish this.
The AnalytiX-BI-based Energy Data Model is made of:
Data Flows
Data Tables
Data Views
Relationships
Prior to deleting any entity, the user will need to review if other energy data model entities depend or reference the entity to be deleted. More specifically:
If the entity to be deleted is a data flow, all related tables, views and associated relationships must be deleted first. If the entity to be deleted is a data table or data view, all related data views and relationships need to be deleted first.
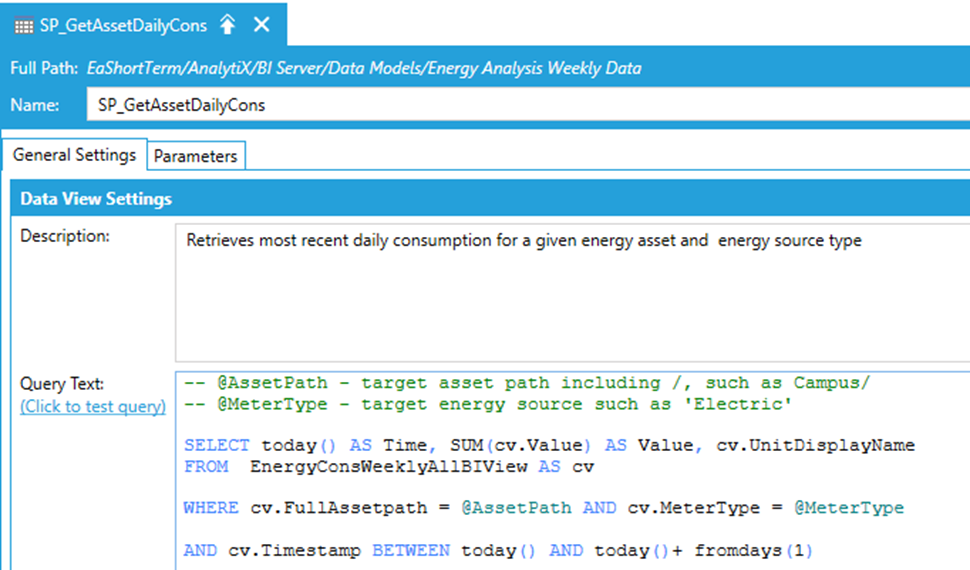
As a use case scenario, let’s say that we would like to remove any carbon-related entities from the weekly data model. The required steps would be:
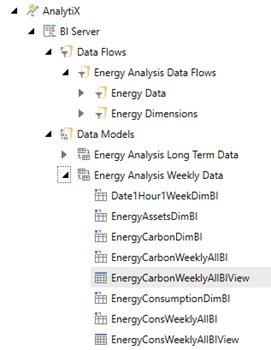
Step 1: Expand the Weekly Energy Data Model and identify carbon-related entities and identify the carbon-related entities.
Energy Weekly Data Model
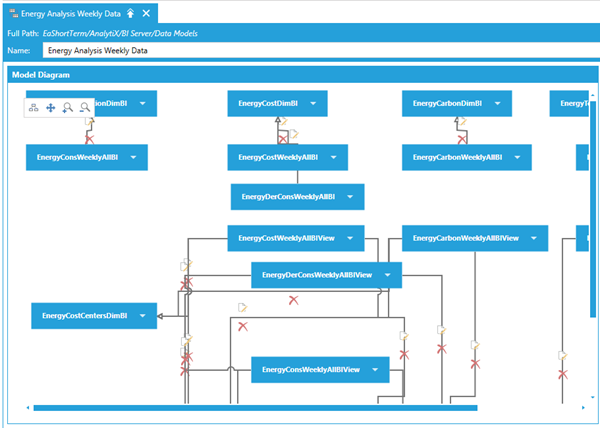
Step 2: Open the Weekly Energy Data Model in the Workbench, and for each carbon- related entity, delete associated relationships and save the Data Model.
Relationships in Energy Weekly Data Model
Step 3: Delete all carbon entities from the weekly data model.
Step 4: Delete all carbon-related Data Flows from the Weekly Data Model.
Another use case scenario would be to add or remove fields from existing data flows, data tables or views. The required steps would be:
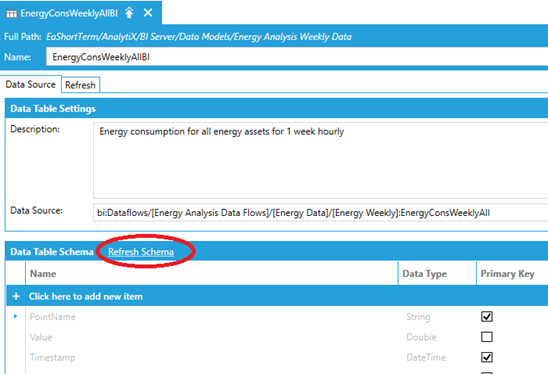
If adding a new column to a data flow, in order to propagate it to the related data table, the user must first refresh the schema of the related data table.
Refreshing Data Table Schema
If removing an existing field from a data table or view, the user should:
Remove any relationships in the data model relating to the field to be removed
Remove any reference of the specific field from related data views
Remove the related field from the data table or data view
In general, any change in the data model’s entities will most likely impact the energy visualization dashboard. As such, it is recommended that users once they complete changes in the Energy Analysis data model that they do review all visuals in the related dashboards and verify that they operate properly. In some cases, users may need to remove visuals for which no data are available in the energy data model while in some cases, pending on the changes committed, all that it is required to add or to remove data model entity field from the related visual’s fields.
Energy assets can be geographically distributed and they can be allocated to different time zones. An Energy dashboard user would like to visualize energy data across same time intervals related to different time zones.
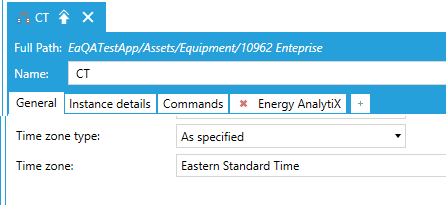
For example, let’s assume that we have defined two time zones in our asset structure.
Multiple Time Zones in Asset Tree
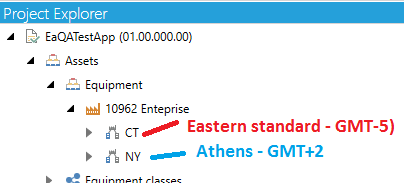
CT -> Eastern Time zone (GMT-5)
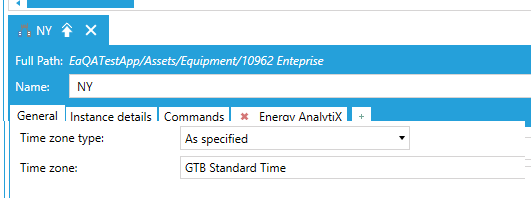
NY->Athens (Greece) (GMT+2)
First Time Zone Properties
Second Time Zone Properties
Now, let’s say we would like to look at data for a calendar day 12:00 AM (today) to 12:00 AM (next day) in local time on 11/17/2020. The corresponding Hyper Historian data request would be in UTC times.
CT -> Eastern Time zone (GMT-5): 5:00 AM (today) to 5:00 AM (next day)
NY -> Athens (Greece) (GMT+2): 10:00 PM (previous day) to 10:00 PM (current day)
Athens Time Zone Info

All energy data model data tables and data views will propagate the energy asset’s Timezone information to the energy data model queries and all energy dashboard filters will operate on the local time of the user visualizing energy data.
In AnalytiX-BI, energy data model all energy dimensions will propagate the time zone information (or emptry string if not defined). The energy data model data flows are modified to use the new time zone support function in AnalytiX-BI (totimezonetime) and to parameterize the data request from Hyper Historian to the appropriate UTC time interval based on the asset’s timezone. Once the data are retrieved in UTC time for Hyper Historian, they will be converted to a LocalTimeZone time using as parameter the timezone of the related asset and then all added columns such as year, month, day, etc will be applied. In the energy dashboard, based on KPIWorX-BI, all date-based filters will work using the newly added LocalTimeZone column and all date-based data filtering will be based on the local time of the energy dashboard user.
Meter Data Repairs
Meter data repairs are done on demand only
User has to select what data to repair in the Energy AnalytiX Workbench Desktop provider and then the service will do the tasks
When getting historical the Energy AnalytiX service provider will convert 12:00 AM to 12:00 AM UTC in the time zone of the energy meter. For example
Local time: 4:00 AM to 4:00 AM in UTC
Pacific time: 7:00 AM to 7:00 AM in UTC
It will then retrieve and group by dates (in local time) the meter data to be repaired
Note that due to different time zones, data from meters from various time zones maybe in the same data group to be repaired
When meter data are repaired, the values to be updated will be selected based on the respective UTC time of each energy meter
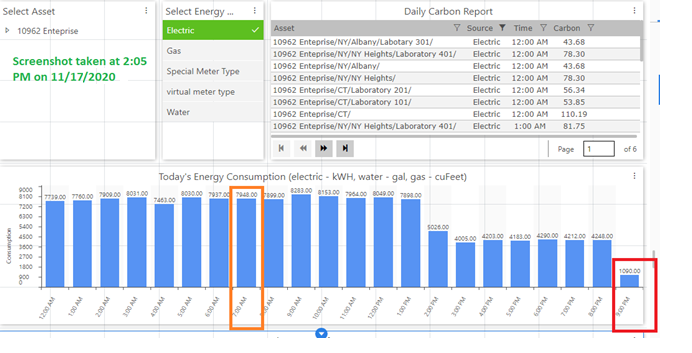
As an example, let us look at hourly data inside Energy AnalytiX' overview dashboard page.
Without any asset selected, we can see data up to 8:00 PM although the screenshot was taken at 2:05 PM at Foxboro on 11/17/2020. This makes sense since NY is in Athens, where the time now is 9:05 PM and the consumption chart rolls up everything at the 10962 Enterprise level.
Overview of Today’s Consumption Data by Hour
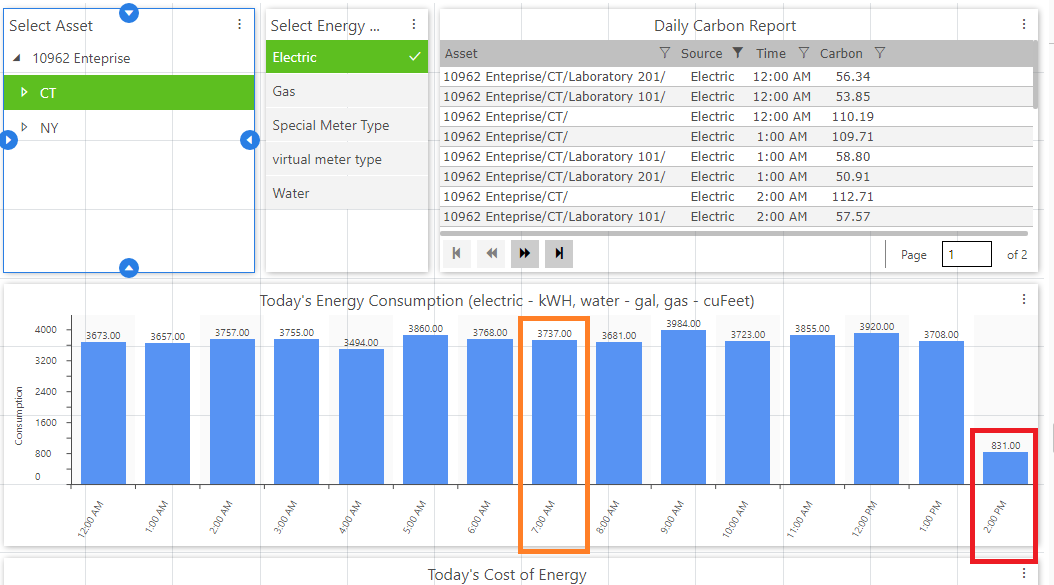
Now, let’s use CT as our selection. Data are displayed until 2:00 PM, since this is our local time and CT is in Eastern (Foxboro) time.
Overview of Today’s Consumption Data by Hour in Eastern Timezone
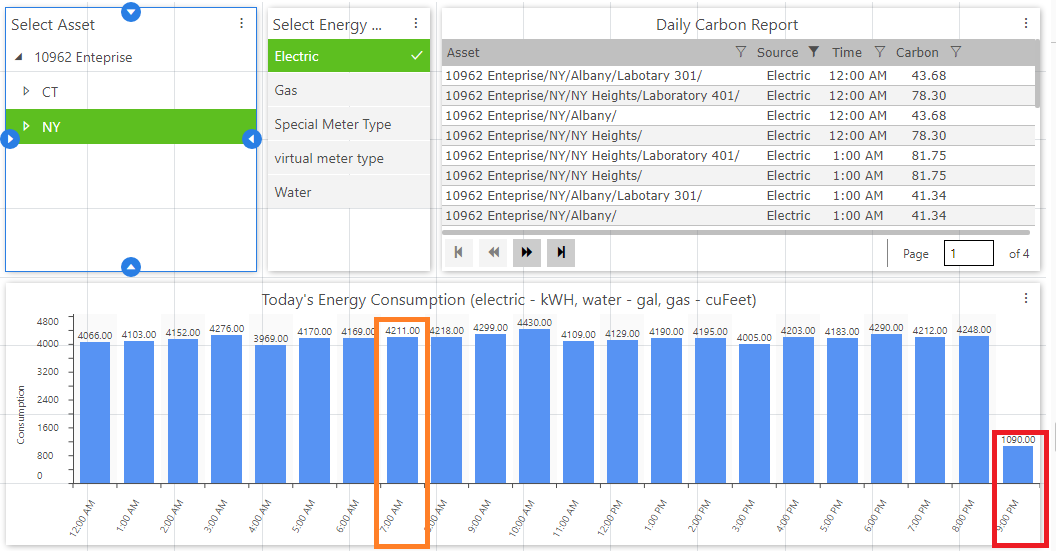
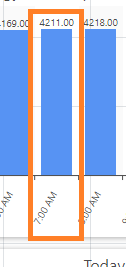
Next, let’s use NY as our selection. Data are displayed until 9:00 PM, since this is our local time and NY is in EET (Athens, Greece) time and there the local time is 9:05 PM.
Overview of Today’s Consumption Data by Hour in Eastern European Timezone
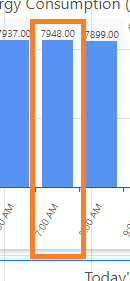
Finally, let’s look at the total consumption at the 10962 Enterprise level. 10962 Enterprise level consumption = CT consumption + NY consumption.
10962 Enterprise-level Consumption (7948 kWH)
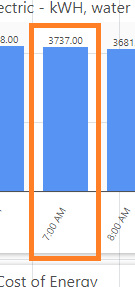
CT consumption (3737 kWH)
NY consumption (4211 kWH)
We have added also support for time zones in related Energy AnalytiX service tasks. In more details:
Degree Days Analysis
Degree days analysis charts are typically done on a calendar day 12:00 AM to 12:00 AM intervals for a time period.
When retrieving historical data for Degree Days Analysis the Energy AnalytiX Workbench Desktop provider will convert 12:00 AM to 12:00 AM UTC in the time zone of the asset. For example
Local time: 4:00 AM to 4:00 AM in UTC
Pacific time: 7:00 AM to 7:00 AM in UTC
It will then retrieve daily intervals based on that time frame in UTC and return the consumption vs degree days pairs to plot the Degree days analysis chart, using daily aggregates of the base summary values
CuSum (Degree Days) Analysis
Degree days analysis charts are typically done on a calendar day 12:00 AM to 12:00 AM intervals for a time period.
When retrieving historical data for CuSum Analysis the Energy AnalytiX Workbench Desktop provider will convert 12:00 AM to 12:00 AM UTC in the time zone of the asset. For example
Local time: 4:00 AM to 4:00 AM in UTC
Pacific time: 7:00 AM to 7:00 AM in UTC
It will then retrieve daily intervals based on that time frame in UTC and return the related data using daily aggregates of the base summary values
Energy Star Data extracts
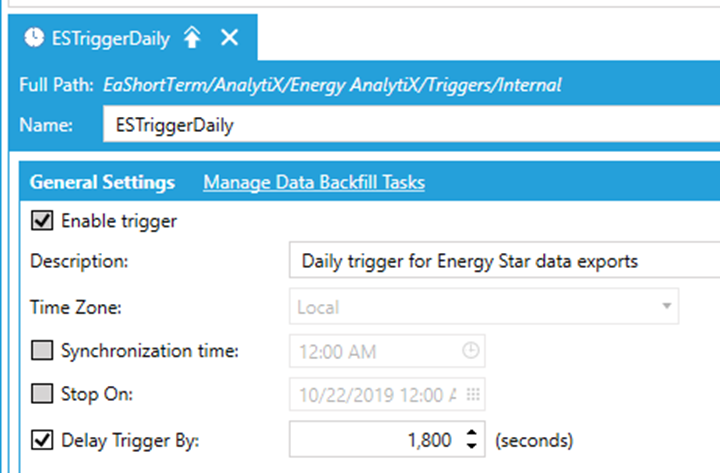
The related periodic data extracts of energy meter data are optional and they are triggered by the single internal trigger in the Energy AnalytiX
Periodically they run at 12:00 AM midnight and retrieve data for a full calendar day (previous day, by summing base summary data)
The data export can also be triggered on demand for a period of days
When getting historical the Energy AnalytiX service provider will convert 12:00 AM to 12:00 AM UTC in the time zone of the energy meter. For example
Local time: 4:00 AM to 4:00 AM in UTC
Pacific time: 7:00 AM to 7:00 AM in UTC
It will then retrieve daily intervals based on that time frame in UTC and return the related data using daily aggregates of the base summary values
Important note:
If time zones exist, then the internal trigger in the Energy AnalytiX Workbench Desktop must be delayed “enough” so all the time zones have a full set of data for a given day when it is running periodically
The energy dashboard is implemented as a set of dashboard pages developed within KPIWorX (under \ProgramData\ICONICS\KPIXStorage\Public). It is supplied as a sample energy dashboard with a general-purpose approach to provide a sample and a starting point for the end user to customize energy visualization to fulfill application requirements. Typically, it will need to be modified by the end user to be made more applicable to the individual energy visualization needs of the end user’s application.
Energy Dashboard Files
The energy dashboard can be accessed by starting a browser and navigating to the KPIWorX default site: http://localhost/kpiworx/default.kpix
Energy Dashboard in KPIWorX-BI
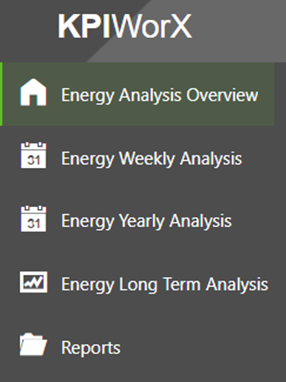
The energy dashboard is structured to have a home page (Energy Analysis Overview) and a number of related dashboard pages within dedicated virtual folders. In general, the following dashboard sections are supplied as a starting point.
Energy Analysis (overview) page
Overview page displays energy data for the current day
Energy Weekly Analysis
Energy data analysis for the last 7 calendar days
Utilizes base summary data aggregated by hour
Energy Yearly Analysis
Energy data analysis for 1 year
Utilizes base summary data aggregated by calendar day
Energy Long Term Analysis
Energy data analysis for 3 years
Utilizes raw daily aggregates calculated by the historian
Reports
Tabular report (grid) displays
Utilizes raw daily aggregates calculated by the historian
Before starting to use the Energy Dashboard, please verify the following:
IIS is restarted
Your energy application is set as the active configuration in Workbench
Hyper Historian Logger service is running
AnalytiX-BI point manager service is running (restart if needed)
An energy dashboard page in general is developed using energy data from the energy data model along with filters to allow the end user to easily analyze energy data based on the current filter context selection.
Energy Analysis Overview page
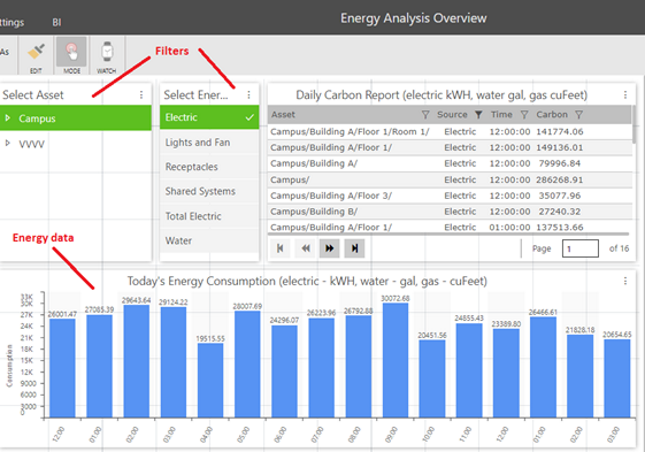
Note: The dashboard filters which are used in single selection mode may have pre-selected values which are based on the source energy sample data that the sample energy dashboard was developed. As such, once the user goes to display runtime mode and selects an existing filter value, the new filter value will take affect and the saved pre-selected filter value will reflect existing values from the user’s energy application.
In the following sections, we will describe with more details each energy dashboard area.
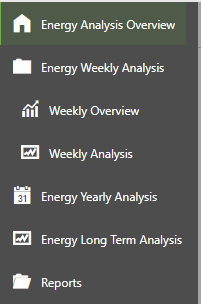
The Energy Weekly Analysis dashboard pages are intended to present a quick summary of energy data for the last 7 calendar days.
Energy Weekly Analysis Folder
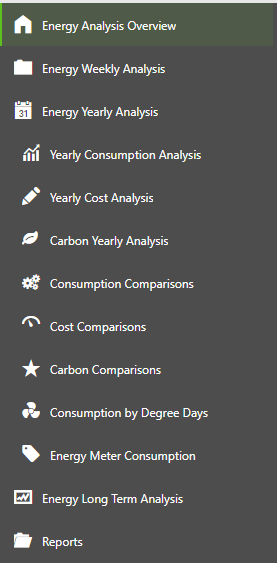
The Energy Analysis dashboard pages are intended to present analysis of energy data for the last 12 calendar months (1 rolling year) using daily resolution for the data.
Energy Yearly Analysis Folder
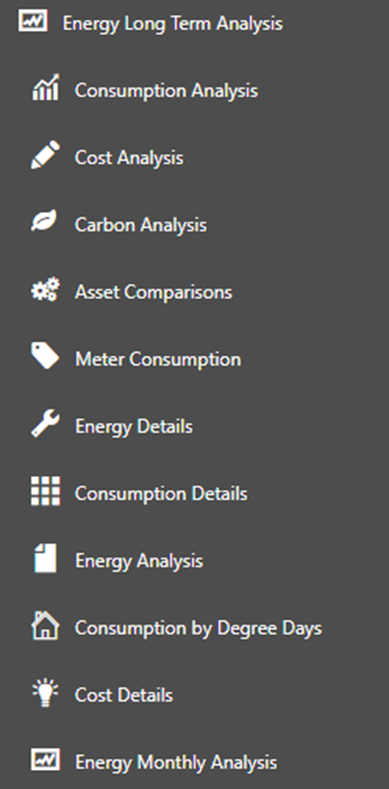
The Energy Long Term Data Analysis dashboard pages are intended to present analysis of energy data for the last 36 calendar months (3 rolling years) using daily resolution for the data.
Energy Long Term Analysis Folder
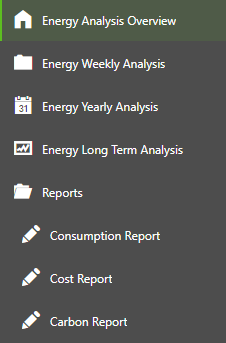
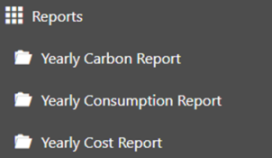
The Reports dashboard pages are intended to present tabular analysis of energy data for the last 36 calendar months (3 rolling years) using daily resolution for the data.
Reports Folder
See also: