![]()
![]()
The thing to remember about a 3D viewport is that it has three dimensions (height, width, and depth), not just the two dimensions in the 2D workspace in GraphWorX64. The dimensions are represented by three axes in the viewport: the X-axis, the Y-axis, and the Z-axis. Knowing the direction of each of these axes is fundamental to navigating in the viewport and to understanding how to use the transformation options.
Because you can manipulate the perspective in the viewport, the orientation is always changing. For that reason, the true orientation of the axes always displays in a legend, at the top right of the viewport.
The X Y Z Axis Legend

In the legend, each axis is labeled with a small pointer. The tip of each pointer points to the axis’s plane. You can see the X with its pointer tip that identifies its plane as the right side of the center cube; this is the X-axis orientation. You will need to keep this in mind when working in the viewport; if you have never worked in a 3D viewport before, it may take you a while to accustom yourself to this type of orientation.
The Legend in the 3D Viewport
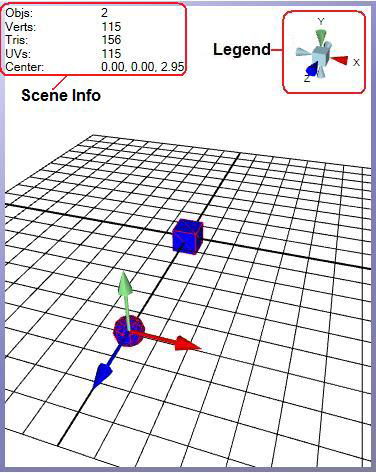
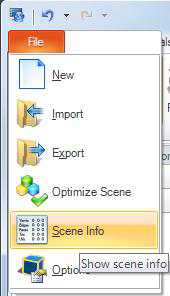
Scene information appears at the top left of a 3D view. Scene information displays for the objects that are currently selected in the 3D viewport. To show or hide the scene information, from the 3D ribbon select File, then Scene Info. Scene information is important only because these are factors that can affect runtime performance:
Objs: The number of objects.
Verts: The number of vertices. The number of vertices on an object affects memory and runtime rendering of a GraphWorX64 display. This number tells you relatively how many polygons there are, and polygons consume memory on the video card. For example, a rough-surfaced sphere with 20 points consumes less memory on the video card than a refined sphere that has 10,000 points.
|
|
Note: A 256 MB video card can hold about 1 million polygons. |
Tris: The number of triangles. Its impact is the same as the number of vertices.
UVs: The number of texture coordinates. Texture can potentially consume a lot of memory.
Note that you can reduce the number of vertices, triangles, and texture coordinates by using the polygon reduction.
See also: