|
|
The features on this page require a GENESIS64 Advanced license and are not available with GENESIS64 Basic SCADA . |

![]()
|
|
The features on this page require a GENESIS64 Advanced license and are not available with GENESIS64 Basic SCADA . |
![]()
The IoTWorX Console is the startpoint to the applications available locally on the IoT device. The IoTWorX Console is split between the "Visualizer", "Diagnostics and Configuration", and "Takebishi DeviceGateway“.
IoTWorX Console
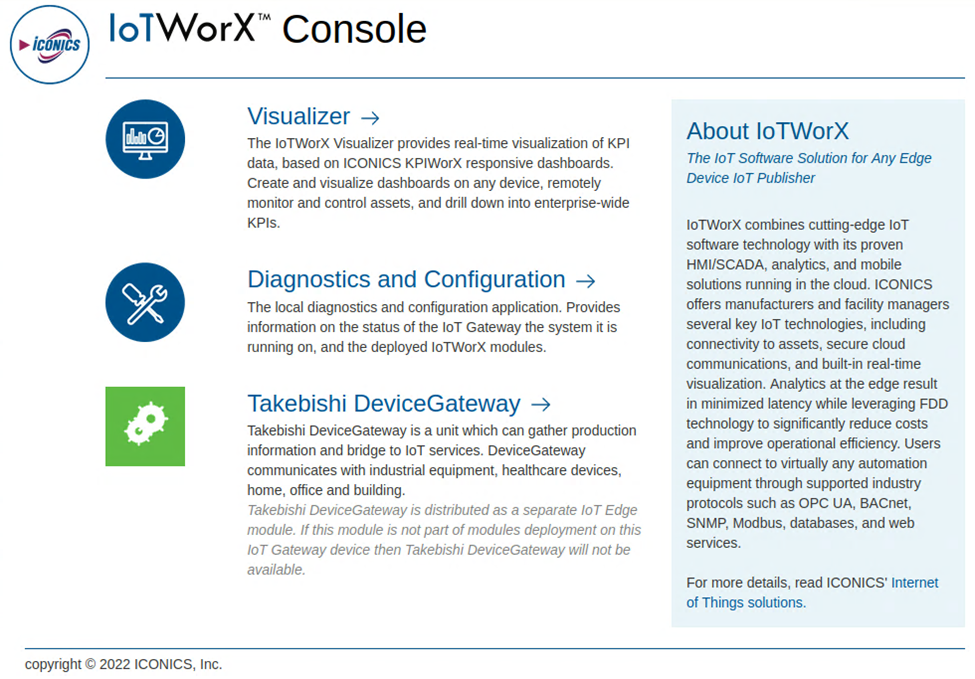
When working with an IoT device to utilize cloud services/resources with ICONICS' automation software solutions, you will be able to access the IoTWorX Console in a manner similar to configuring a wireless router. Once you determine the IP address of the device, you can access the IoTWorX Console, shown below, via a web browser by browsing to http://<<DeviceIPaddress>>/, in order to make any required configurations. IoTWorX detects the language version of your web browser and sets the localization accordingly. Apart from the default English version, it currently supports displays in French and Japanese.
The IoTWorX™ Visualizer provides real-time visualization of KPI data, based on ICONICS KPIWorX™ responsive dashboards. Create and visualize dashboards on any device, remotely monitor and control assets, and drill down into enterprise-wide KPIs.
The local Diagnostics and Configuration application provides information on the status of the IoT device, the system it is running on, and the deployed IoTWorX modules. There are also tools with the status of the device-to-cloud communication, and the performance and diagnostics counters of the various IoTWorX modules.
Takebishi DeviceGateway is a unit which can gather production information and bridge to IoT services. It communicates with industrial equipment, healthcare devices, home, office, and building. The IoTWorX Console integrates the DeviceGateway configuration tool on IoT device.
See more details about Takebishi DeviceGateway.
See Also: