![]()
![]()
From time to time, you may perceive that your system suffers from unexpected behavior that you would like to eliminate. However, you have no idea what could be wrong. In the task of diagnostic and troubleshooting the applications, you may take advantage of the following tools:
TraceWorX64
GenEvent Server
Event Viewer
TraceWorX64 provides online diagnostics and tuning of applications running in the GENESIS64 system. It is designed for system integrators, OEMS, and customers who want tools for doing their own troubleshooting and diagnostics. Trace files provides valuable information that you can present when you contact ICONICS Technical Support. Nevertheless, it is not recommended to have TraceWorX64 turned on constantly because it may put additional load on your system resources.
TraceWorX64 tracks the runtime activity for each GENESIS64 application and logs the runtime data to a log file based on user configured trace levels. The log file provides a thorough, color-coded report detailing all activity for the application, including the time, the date, the severity level, and the description of the event or problem. In general, you may start any GENESIS64 application either via Start Menu or through ICONICS Workbench. As Workbench is meant to be the starting point for your applications, we will consider it having already been launched.
Launch TraceWorX via the TraceWorX button in the Tools ribbon in the Workbench. A TraceWorX Configuration and Log Viewer window opens. It will look something like the following:
TraceWorX Configuration and Log Viewer
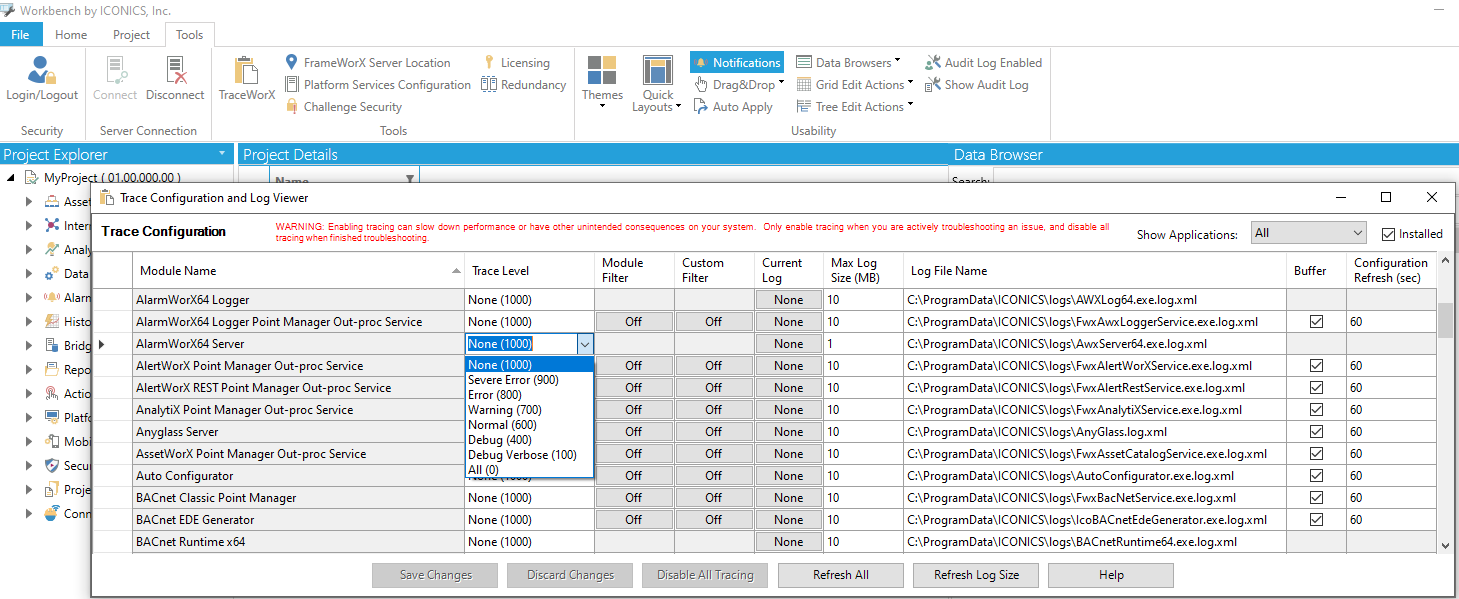
The table shows all modules that can be traced. Use the Installed checkbox in the top right corner to display only modules which are currently installed. Note: If TraceWorX cannot determine what is currently installed on the machine, this "Installed" option will be automatically unckecked and disabled (i.e. all modules will be shown). This situation can happen for example if you copy TraceWorX binaries to a machine that does not actually have GENESIS64 installed (which you might do to trace XBAP clients).
By default, tracing is disabled for all applications. In the drop-down menu for the Trace Level field you can select any of the trace level options for each application, starting with None to log nothing and ending with All to log everything. Be cautioned that this may slow down your system a bit. You may want to turn the tracing level to something low (i.e. Error), which will have lower impact on your system performance.
You can change the Max Log Size if you wish. A size of 0 MB means the file can grow indefinitely big.
You can set a Module Filter or Custom Filter. (See Configuring TraceWorX64 for more details).
You can choose the location of the log file via the Log File Name column. When you click into an individual log file name cell, an ellipsis button ![]() appears on the right. Clicking it will directly open the defined folder so you can save the log file or instantly access previously stored log files.
appears on the right. Clicking it will directly open the defined folder so you can save the log file or instantly access previously stored log files.
Save Changes once you are done configuring tracing for all applications in question.
Run the application in question to reproduce the error or for some time. Once you have reproduced the error, you should turn off tracing for the application.
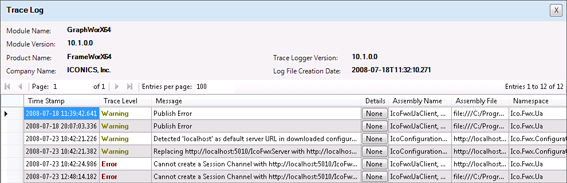
Go back into TraceWorX64 and view the trace file by clicking on the button reading the current size of the log and selecting View Log. You can also pack the file into a zip archive or delete the file.
Your tab will split and the new pane will display the contents of your log similar to the one depicted below.
Log Content
While TraceWorX64 is quite a complex troubleshooting tool that you may turn on, independently customize trace levels, and maintain your logs, you can take advantage of another simple tool to track standard application events in GENESIS64 suite.
Almost all GENESIS64 components post messages to the internal Event Server called GenEvent Server. This server is an OPC AE server that your clients can subscribe to, which allows you to view informational messages. These messages contain basic status information about applications, operator changes, etc. The most common way to view them is by means of the AlarmWorX64 Viewer.
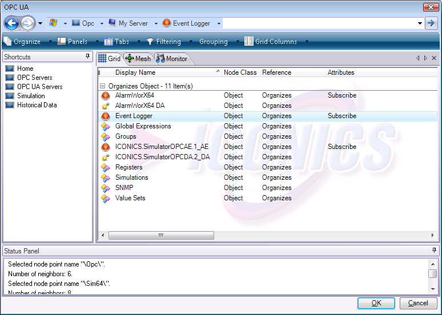
Into a GraphWorX64 display, insert AlarmWorX64 Viewer.
Subscribe this control to the Event Logger server.
GenEvent Server Selection in Data Browser
NOTE: In order to find more information on how to create subscriptions and customize AlarmWorX64 Viewer see corresponding application notes in AlarmWorX64 section.
View the ICONICS application events in GraphWorX64 runtime.
Genesis Events in AlarmWorX64 Viewer
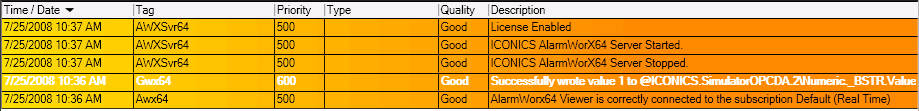
NOTE: If you exit runtime, all event messages will permanently disappear from the AlarmWorX64 Viewer. You will not be able to retrieve them unless you had stored them by means of AlarmWorX64 Logger.
Event Viewer
For your convenience ICONICS implemented the option to show all GenEvent messages in Microsoft Event Viewer so that you can easily store and review them together with other application event messages. All these application event messages are stored in Application section of Windows Log.
In the classic Workbench, select the FrameWorX Server provider in the Project Explorer.
Expand the FrameWorX server tree control, and double-click GenEvents.
GenEvent Configuration Tab
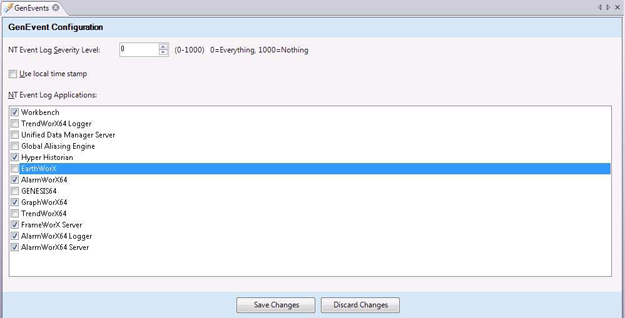
Mark all applications you want to post events to Event Viewer.
Click Save Changes and then open the Event Viewer to review the logging of events. (You can launch the Event Viewer from the Windows Control Panel's Administrative Tools.)
Event Viewer Application
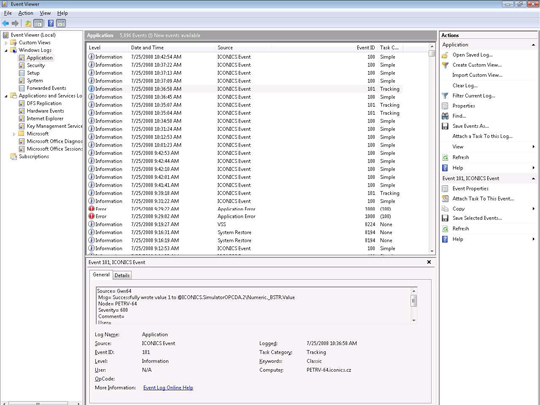
NOTE: All ICONICS application messages come from ICONICS Event source and can be identified as such among other Application events.
See also: