![]()
![]()
The TrendWorX64 Viewer is a client application that provides real-time and historical data trend displays within the GENESIS64 product family. The viewer communicates to OPC UA servers (including legacy Data Access (DA) and Historical Data Access (HDA) servers) to provide trend displays based on the connections to the data source that you specify. In TrendWorX64 Viewer, you control the manner in which the server is polled.
In the viewer, you determine:
Which OPC data source(s) are displayed
What the display looks like: chart types, pen attributes, summary data, legends, axes, and more
How data in the plots are displayed
|
|
Note: TrendWorX64 Viewer displays both real time and historical data. If you intend to store OPC data for later trend display and analysis, use the TrendWorX64 Logger to stored the data into a SQL server database. |
Keep in mind that GENESIS64 uses .NET Framework controls which abstracts data location, allowing for the creation of distributed systems. The TrendWorX64 Viewer is more properly described as a "control" object, and is itself a container that can contain additional objects. The two most common objects commonly used in TrendWorX64 Viewer are the plot object and the pen object.
TrendWorX64 Viewer has three different modes:
Configuration Mode: Properties may be altered in this mode. Changes you make to properties are shown immediately in the sample display. For more information, refer to the Working With Trends and TrendWorX64 Viewer Configurator topics.
Runtime Mode: Data is collected and displayed and the chart updates appropriately. For more information, refer to Runtime Operations in TrendWorX.
Freeze Mode: During runtime you can freeze the display and examine it. Your viewer is still collecting data, but the display isn't updated with current data until you leave freeze mode. Freeze/Unfreeze operations are also available through the Ribbon (click on "Freeze" in the Data Analysis section of the ribbon).
To Switch Between Configuration Mode and Runtime Mode:
Click the Runtime button at the right of the display
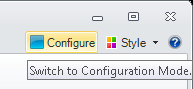
Click the Configuration button at the right of the display to go back to configuration.
To Switch Between Runtime Mode and Freeze Mode:
Click the Freeze button on the runtime toolbar to go into freeze mode.
Click the Freeze button again on the runtime toolbar to exit freeze mode and display current runtime data.
You Can Move Your View by Any of the Following Operations:
Click the top plot to moves the cursor to that position.
Click the bottom plot or move the cursor icon beneath that plot to move the cursor larger distances.
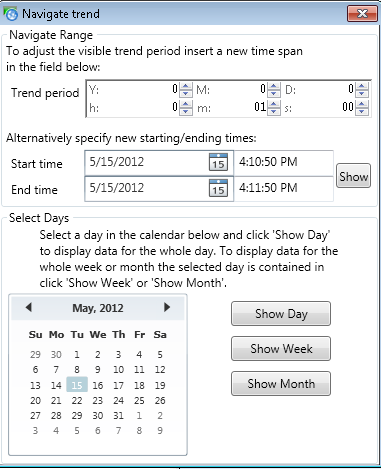
Click the Move Trend buttons on the runtime toolbar to move the time you want the cursor to display at in the Navigate trend dialog box. The Set Time operation is also available through the TrendWorX64 Runtime ribbon (click on Set time in the Navigation section of the ribbon).
|
|
Note. If you are running GENESIS64 on Windows 7 and are using Multitouch, several Multitouch features are available to runtime users. For more information, refer to GENESIS64 Features on Windows 7. |
The TrendWorX64 Viewer control can be dragged and dropped into GraphWorX64, where it has the same functionality as it does in the Workbench. There are some additional settings found in the GraphWorX64 property sheet.
To Place an TrendWorX64 Viewer Control into the GraphWorX64 Design Surface:
From the Start menu, select All Programs > ICONICS > GENESIS64 > GraphWorX64 > GraphWorX64.
Click the Controls ribbon and then click the TrendWorX64 Viewer control button.
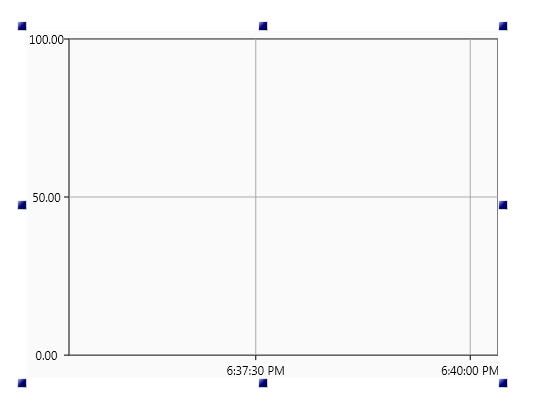
On the work surface, click and drag the crosshairs until you have the control size you desire or click once to put a control box at the default size on your screen. After a moment you will see the Viewer control appear with its selection handles visible. You can click the object to select it or click the design surface to deselect it. You can modify its shape and size by grabbing and dragging the handles.
What you see in the control is simply a graphic and doesn't indicate the data or data sources. You can perform a few selected operations in Configuration Mode by using the TrendWorX64 Viewer Configuration ribbon. Once you enter Runtime Mode, you can double-click the control to access the TrendWorX64 Viewer runtime toolbar. This toolbar includes buttons for opening a specific configurator (pen/trend/period), changing views, modifying visual elements, and applying themes. All of these commands (and many more) are described in Display Options and Pens.
|
|
Note: The TrendWorX64 Viewer Configuration ribbon contains a button in the Configure group to open the main configurator. |
|
|
Warning. Not all features are supported in Microsoft Silverlight. If you are saving Silverlight files, refer to Silverlight Files in GENESIS64 for more information. |
As you make changes in the ribbon, the graphic you see for the control changes to indicate the effect.
To Enable a Trend Display:
Determine the number and types of charts you see and organize them into tab groups. Charts are containers that can show one or more chart types.
Create one or more Plots, which are collections of the same types of chart style: line, area, bars, and so forth.
Create one or more pen objects, which determine the data that is displayed.
Set the data source for each pen, establishing a connection to the tag values.
|
|
Note: Trend data connects to OPC UA Data Access (DA) real-time sources and OPC-HDA historical sources. Unlike alarm data where the alarm data contains one or more fields (such as severity, acknowledge, etc.), trend data displays a single value that changes over time. |
Alter the appearance of the chart as you desire (optional).
|
|
Tip: The appearance options that you see in the AlarmWorX64 Viewer are identical to the ones that appear in the TrendWorX64 Viewer . Data sources and connection properties are very different. |
With these defined features, save your trend display and click the Runtime button to view real-time or historical trend data.
To return to Configuration mode, click the Configure button.
New in TrendWorX64 Viewer
Click HERE for info on the latest improvements to TrendWorX64 Viewer
See also: