![]()
![]()
Contents Hide
The categorical chart, trend widget, and microchart widget all can display series' of data in different formats. This article describes these different plot types.
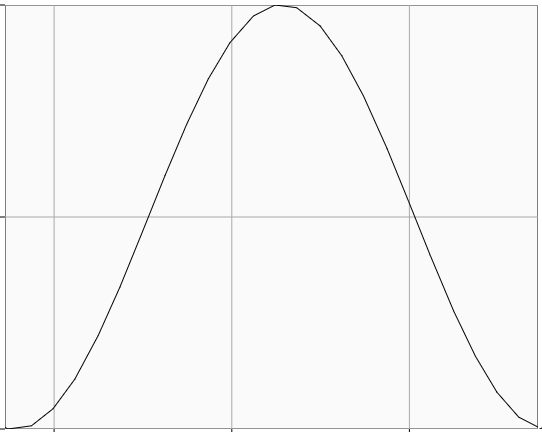
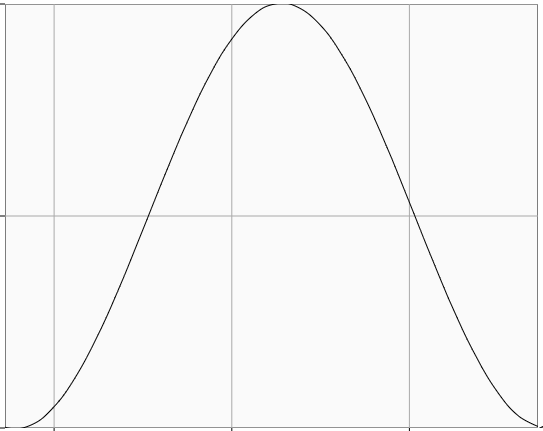
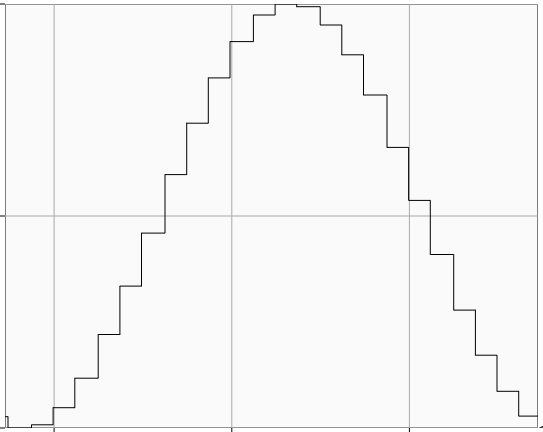
These plot types connect samples with a line. The regular line type draws a line directly to the next point. The spline type interpolates the paths and creates a smoother connection between points. Stepline draws a straight line across then up or down to each point, creating the appearance of steps.
Line
Spline
Stepline
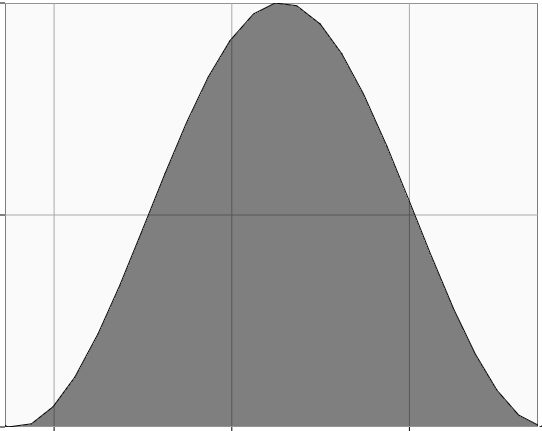
These plot types behave the same as Line, Spline, and Stepline, respectively, except they fill in the area below the line.
Area
SplineArea
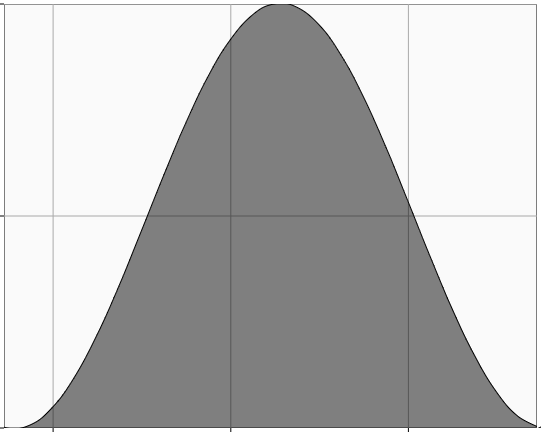
StepArea
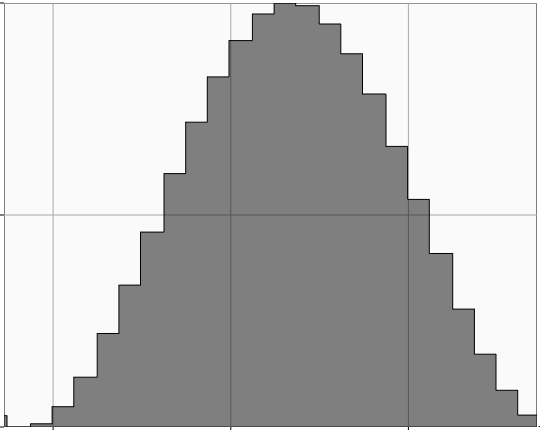
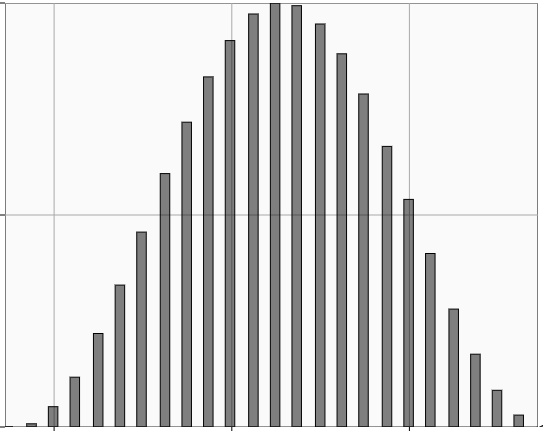
A bar series displays the information as a series of bars.
Bar
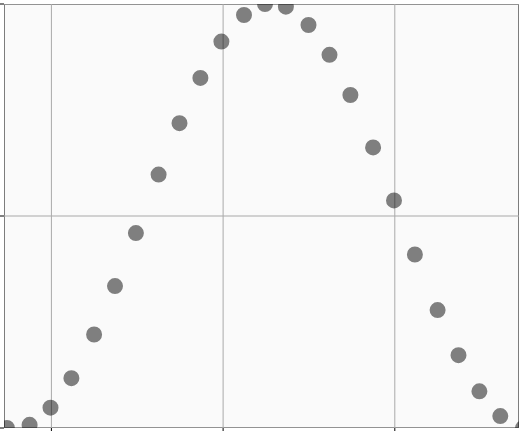
A point series displays information as points with no connecting lines.
Note: The trend widget does not support the point plot type. To achieve a plot point, use a line plot type, make samples visible, and change the line thickness to zero.
Point
Note: Bubble, Candle, Column, EventBar, OHLC, Pie, and XY and are not currently supported. Choosing these plot types will result in a type of Line. These options should be hidden in a later update and only returned when support for them is added.