|
|
The features on this page require a GENESIS64 Advanced license and are not available with GENESIS64 Basic SCADA . |

![]()
|
|
The features on this page require a GENESIS64 Advanced license and are not available with GENESIS64 Basic SCADA . |
![]()
The EarthWorX control in GraphWorX64 is easy-to-use, and it allows for powerful operations. This topic describes how to use the EarthWorX control in GraphWorX64. Because it is just a brief introduction to EarthWorX, you are encouraged to play with it and try adding different objects. You can, for example, add polylines too, as well as other user controls.
To start using EarthWorX, you will first need to launch GraphWorX64. Once the new display is ready to work with, go to the “Controls” ribbon and select the “EarthWorX Viewer” control to add it to the display.
Adding the EarthWorX Viewer Control to a Display

Alternatively you can also use the Toolbox to access the same functionality.
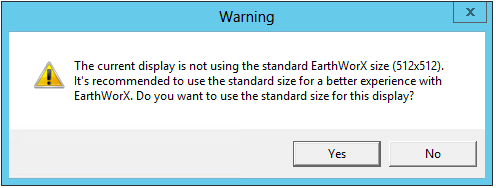
Once the control has been added to the display, a warning message pops up to inform you that the display is not using the default EarthWorX size and will provide the choice to automatically resize the display. The reason for this choice is due to the EarthWorX world map having a default size of 512x512 pixels at its minimum zoom level. If your display is bigger than that, then you might end up having white areas around the map. However, it should be noted that if the final map will be zoomed in to a particular region or country, you can use another display size without any white space around your selected map.
Warning Message about Display Size
This example will use a default size display; therefore, select Yes to the above question. Once the display is resized, another Warning will come up.
Warning Informing about Bing Maps License Restriction
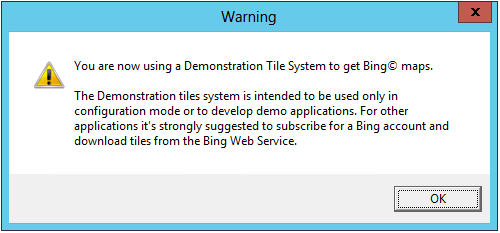
The above warning message informs you that you are now using the demo version of Bing Maps. Microsoft allows you to use the maps with some limitations. However, for real applications, you should obtain a valid license from Microsoft. For the purpose of this example, you can continue using the demo tiles to evaluate the functionality of the EarthWorX control. After you click “OK”, the display will contain the EarthWorX map and you are ready to start working with it.
EarthWorX Map in the Display
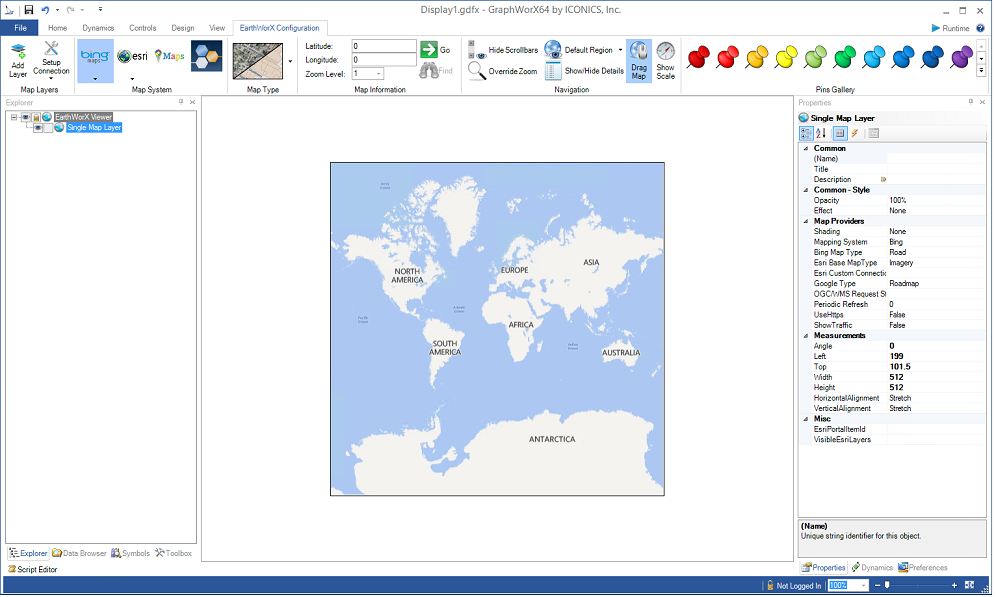
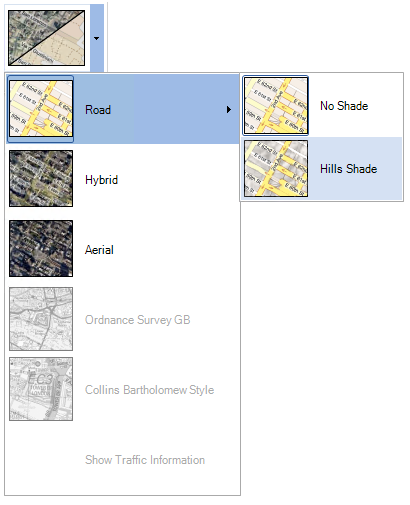
Start the map interaction by zooming in on it as you would do in a regular GraphWorX64 display. The map will load additional details as needed while zooming and panning over it. Alternatively, you can also use the commands provided in the EarthWorX Configuration ribbon to perform other operations, including changing the map type, jumping to a specific location, import additional data, adding pushpins and much more. To change the map type, click on the “Map Type” button in the “EarthWorX Configuration” ribbon, and select your preferred map type.
Available Map Types
Generally speaking, you use EarthWorX to keep track of geographically dispersed assets, normally by adding objects on the map to represent those assets.
Adding a Pushpin
In this example you will add a Pushpin to the map. To do this, click on one of the Pushpin icons in the “EarthWorX Configuration” ribbon in the “Pins Gallery” section.
Pins Gallery
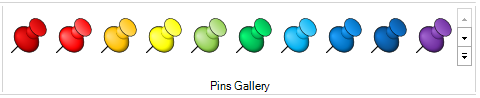
After clicking on a Pushpin icons, click on a location on the map. In the example below, the user clicked on Rome, Italy, to position the Pushpin in that location; this adds a new object over the map. You can easily relocate the object by dragging it around, and you can resize it, as needed. For more help, refer to the PushPins topic.
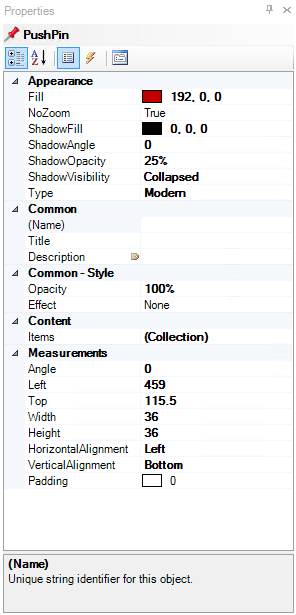
The pushpin's Properties tab shows several properties for the object, which you can change as required.
Changing Properties for the Pushpin
Adding Polygons
Pushpins are not the only objects you can put on a map. They are basic shapes that are easy to access, and for that reason may be suitable for many applications. But you may need to use other shapes to achieve what you're trying to do with EarthWorX.
An alternative to Pushpins would be to highlight a specific geographic area and change its color depending on some values, for example to monitor your company sales activity in a region and to change the color if sales meet the expected target.
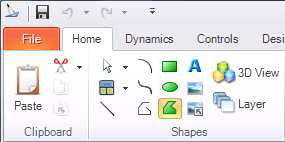
To do this, select the Polygon icon from the Shapes box in the “Home” ribbon, highlighted in the following figure.
Selected the Polygon Command
The mouse cursor will change to indicate the polygon drawing mode. Now, click on the points of the map that represent the border of the desired region. In this example, the border of the state of Massachusetts has been drawn.
A Polygon Drawn on the Map
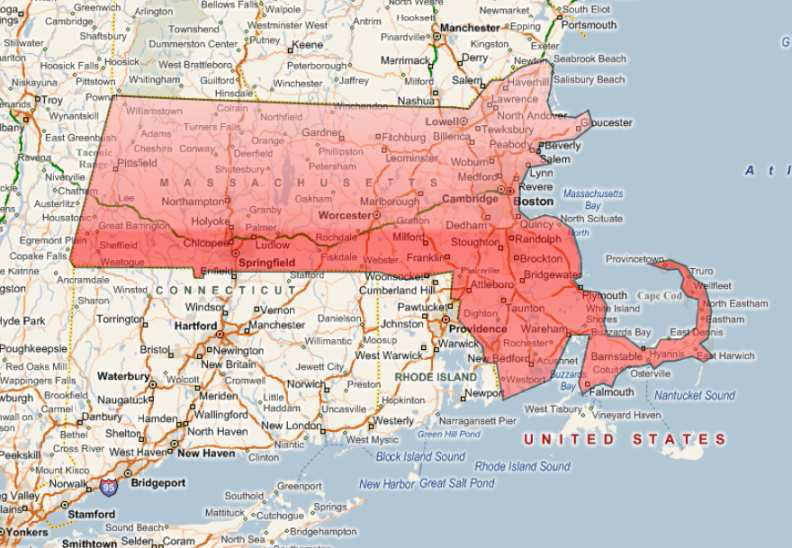
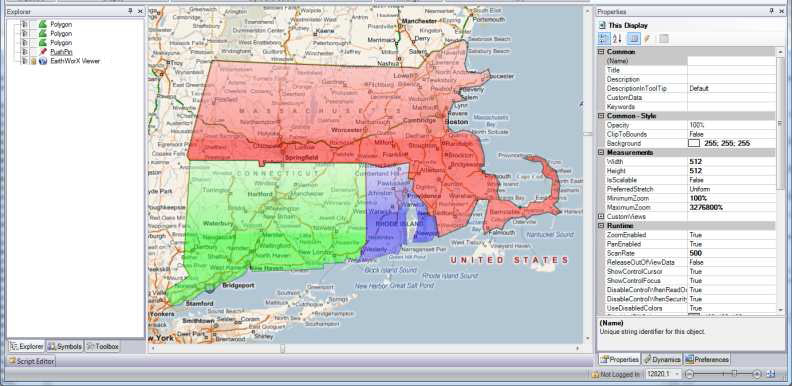
The polygon object is a regular GraphWorX64 object. You can add dynamics or a pick action to it, for example to change its color depending on a data value or expression, or add a pick field to open a new display with that area’s details when the polygon is clicked. Using the same method you can create additional polygons to enclose two other U.S. states as shown in the following example to complete this example. For additional information, refer to the Dynamics in the GraphWorX64 Interface topic, as well as the Shapes topic.
Some More Polygons Added
See also:
Dynamics in the GraphWorX64 Interface