|
|
The features on this page require a GENESIS64 Advanced license and are not available with GENESIS64 Basic SCADA . |
|
|
The features on this page require a GENESIS64 Advanced license and are not available with GENESIS64 Basic SCADA . |
The following provides a guide to optimizing Energy AnalytiX application performance. A familiarity with and knowledge of Microsoft SQL Server databases, Windows operating systems and general energy management application concepts is required, as is familiarity with Energy AnalytiX.
This topic provides a guide on how to optimize Energy AnalytiX applications. It provides a look at the various areas of an energy application deployment along with the available approaches for optimizing performance and load balancing various aspects of Energy AnalytiX application deployment.
Energy AnalytiX is an analytics data-driven application for Energy Management. It operates on collecting data from various data sources such as real time, historical, WEB services based and external data and then utilizes the collected data into evaluating user defined energy calculations. It is designed to operate using key ICONICS technologies, including:
Asset AnalytiX
Hyper Historian
AnalytiX-BI
KPIWorX-BI
Triggers
Overview of Energy AnalytiX Architecture
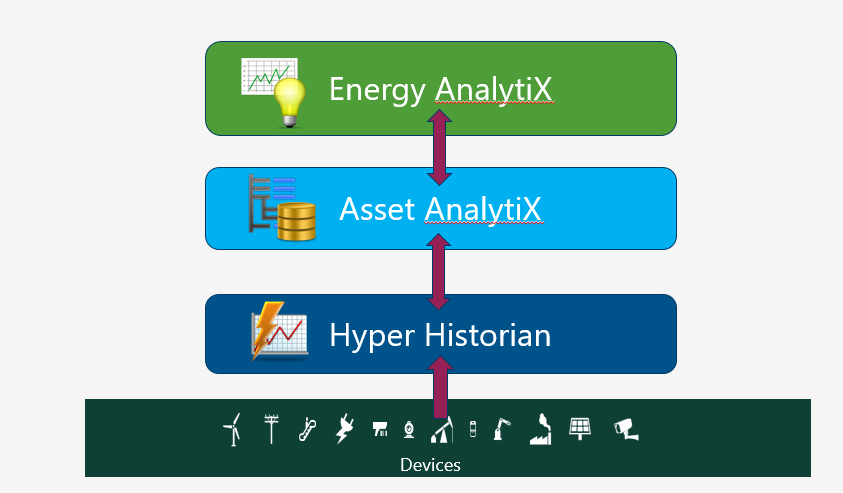
Energy AnalytiX classifies the collected data by functionality such as:
Meter Data
Weather Data
Cost Data
Energy Variables
Energy Calculations
Internally, it creates interval based data both for meter summaries as well as energy calculations for key periods such as
Base Summary Interval (typically every 15, 20, or 30 minutes)
Other data aggregates, as enabled by the user under the General Options > Energy Data Aggregates tab
The above interval-based data are utilized by the data access API to provide energy data for weeks, months, years in addition to days, hours and base summary interval data.
In addition, Energy AnalytiX utilizes energy variables to produce rich energy related analytical data which can be easily displayed in built-in charts and reports.
Energy AnalytiX Internals
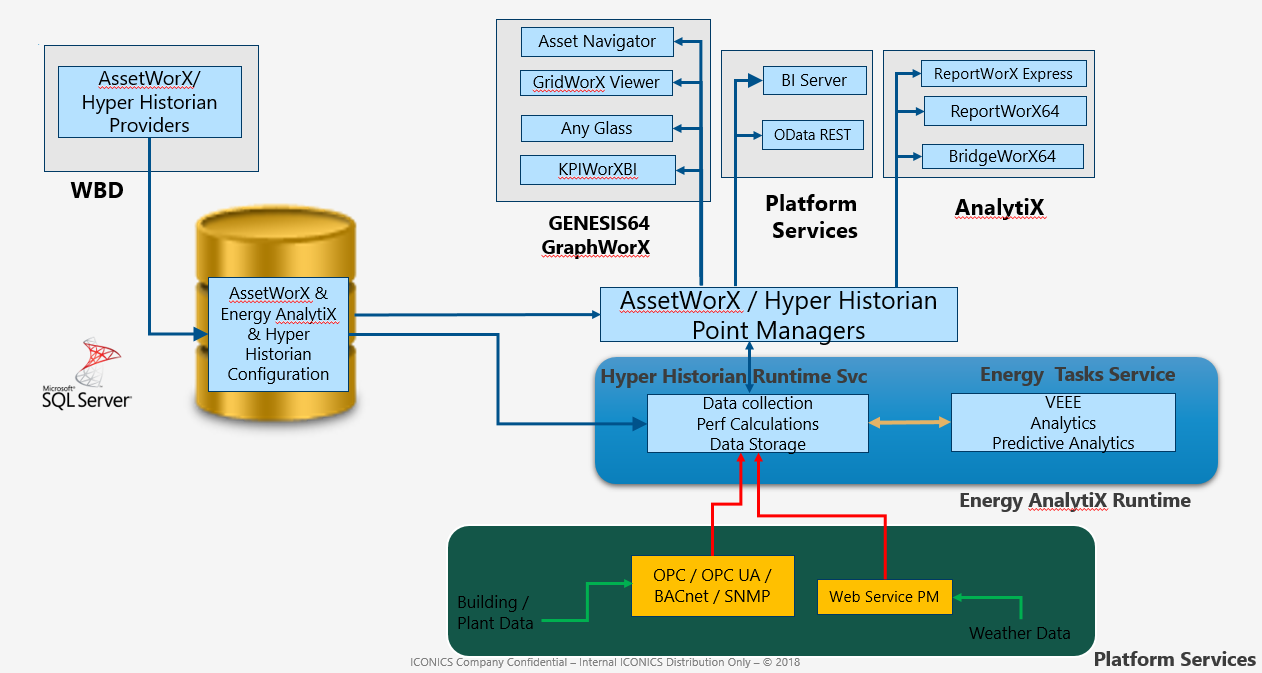
In order to facilitate advanced analytical capabilities, Energy AnalytiX utilizes several key concepts.
The key concepts provide rich analytics results and allow Energy AnalytiX to support advanced data viewing. In summary, the key concepts are:
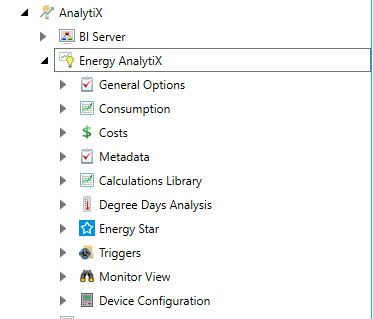
Energy AnalytiX Provider in Workbench
Energy AnalytiX Assets in Workbench
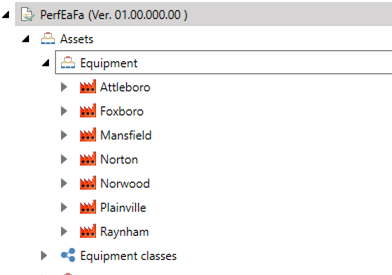
The AssetWorX asset tree is utilized to add Energy AnalytiX extensions to user configured assets (equipments). Using the Asset tree, Energy AnalytiX supports two types of energy-related assets:
Regular Energy Assets (like Building, Floor, etc.)
Energy Meters (like Electric, Gas, Water, etc.)
Meter Types
They are utilized to provide analyze energy data by energy source such as electric, water, and gas. They are quite flexible and they can be used even for non-energy source related counts such as production counts, plug load association etc. Meter types can also be used to support energy source segmentation, by defining appropriate meter types such as
Cost Centers
They are used for cost allocation, such as organizational areas or tenants and for estimating cost of energy. They can also be used to filter logically areas of energy reporting and to quickly identify possibilities for further improvements.
Energy Variables
Energy Variables are used as calculation variables in defining Energy calculations, such as energy consumption normalized by square footage. They can be static or time varying. They are also utilized for filtering energy assets in reports
Calculations Categories and Calculations library
Energy AnalytiX supports several types of energy calculations. Standard, derived, carbon and cost calculations.
Calculation categories are used to categorize energy calculations data in groups, so that the runtime charts and reports can produce meaningful visualization and reporting results. They are also used in runtime filtering operations.
Periodic Triggers
The periodic triggers are utilized to trigger data from Hyper Historian. Currently, one predefined periodic triggers is supported for Energy Star data extracts.
There are several areas to look when optimizing performance of an Energy AnalytiX application. The key areas include
Energy Data Strategy
Overall Application Load
Microsoft SQL Server Deployment
Client Side Energy Data Visualization and Reporting
Monitoring Application Performance
In this help topic, we will focus on the above key areas and we will provide helpful insights for best practices.
In this section, we will take a look at defining an energy data strategy to satisfy the needs of an energy application while producing good performance. Energy AnalytiX is an analytics-driven application with a historian (Hyper Historian) back end.
As such, setting up a data strategy to control the volume of historical data maintained by Hyper Historian is essential to the overall performance of your energy application. This can be accomplished via the archiving management tools in Hyper Historian.
Energy AnalytiX will also output some data in the AssetworX MS SQL database. You can set size limits for the related database tables using the General Options in the Energy AnalytiX Workbench provider.
General Options
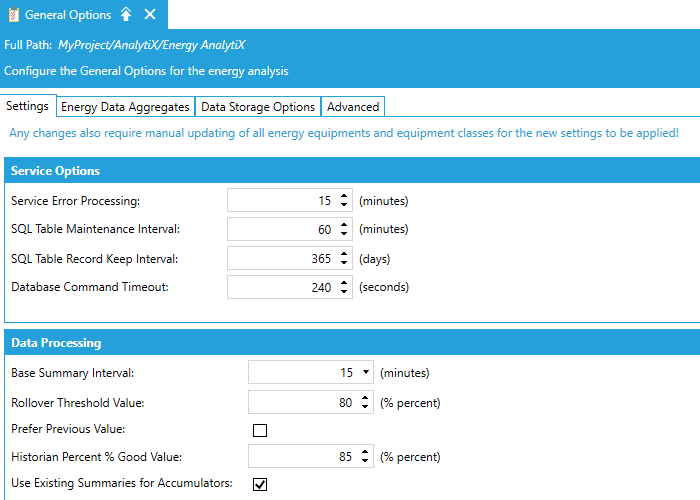
In the General Options, the end user can define data collection, data aggregates, as well as data storage options.
Hyper Historian Archiving Management in Workbench
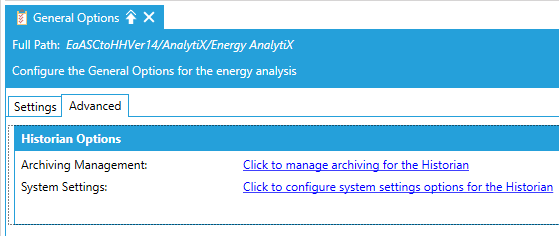
In this section, we will take a look at the key factors in determining the overall load of an Energy AnalytiX application. The key factors influencing application performance are:
Count of Meter Tags
Count of Energy Meters
Count of Energy Assets
Count of Calculations
Count of Energy Variables and Rate of Change
Data Maintenance Interval
Data Visualization Needs and Reporting Volume
In general, here are some guidelines:
For high count of meter tags, we would suggest using cumulative type of counters or differential with slower data collection rates, such as 15 minutes.
Other factors that can influence the application load would be the volume of meter data imported to Energy AnalytiX via Hyper Historian's MergeWorX module. It is recommended that external or historian-based data import is load balanced to import data for reasonable intervals such as no more than one month at a time.
In this section, we will take a look at the monitoring your Energy AnalytiX application performance. You can monitor application performance though ICONICS tools as well as through Microsoft SQL Server tools.
Using ICONICS Workbench to Monitor Application Performance
In Workbench, you can use the Energy AnalytiX provider Monitor View to get diagnostic information regarding your Energy AnalytiX application with respect to:
Overall Application Load
Hyper Historian Tag and Calculation Load
Energy AnalytiX Monitor View in Workbench
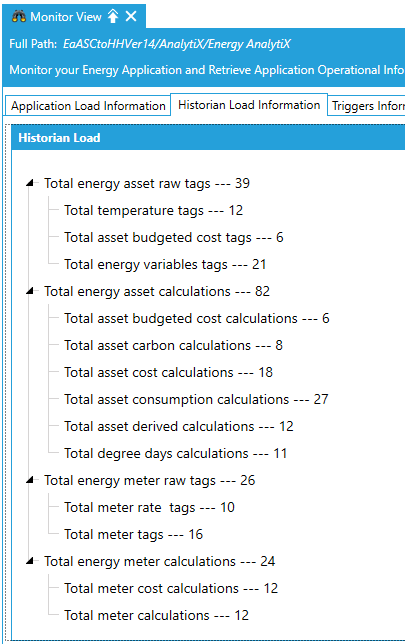
In addition, TraceWorX should be enabled for the following Energy AnalytiX-related ICONICS services:
Energy AnalytiX
Hyper Historian Logger
AnalytiX-BI
AnyGlass (for KPIWorX-BI)
Triggers
To evaluate and troubleshoot your Energy AnalytiX application, you will need to evaluate performance and resource allocation across all modules of the Energy AnalytiX infrastructure.
See Also:
How Energy AnalytiX Runtime Works
Energy AnalytiX Runtime Overview
Working with Energy AnalytiX Runtime Modules