![]()
![]()
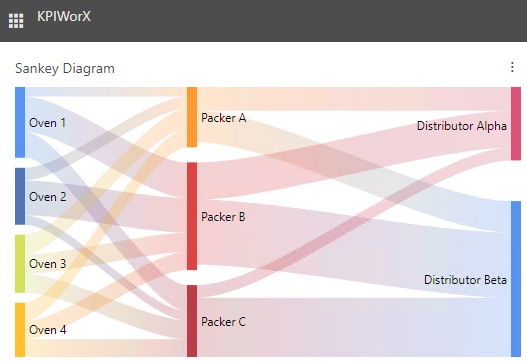
The Sankey Diagram widget in KPIWorX helps to illustrate flow between different sources and destinations.
Sankey Diagram Widget in KPIWorX
The Sankey diagram can be found in the Charts section of the Component Library. It expects two datasets. One must have three columns, a source, a destination, and a weight. These are mapped to the From, To, and Value fields of the widget, respectively. The other dataset must be a list of the possible From and To node names. This is mapped to the Nodes field of the widget and must match the values in the From and To columns of the first dataset. Currently the dataset used for the Nodes field only needs a single column, but additional columns may be used in the future to specify properties of the nodes, used in customizing the Sankey diagram.
This separate Nodes dataset must come from the same AnalytiX-BI data model. Using a separate independent dataset (such as two GridWorX datasets) is not supported. Users have the option of using the same column as the From or To fields for the Node field, even if not all possible nodes appear in the column. (For example, if your data source has three columns, FromNode, ToNode, and Weight, you could use FromNode for both the Node and From field.)
There is also a Sankey diagram control available for GraphWorX64 and MobileHMI displays.
See Also: