|
|
The features on this page require a GENESIS64 Advanced license and are not available with GENESIS64 Basic SCADA . |

![]()
|
|
The features on this page require a GENESIS64 Advanced license and are not available with GENESIS64 Basic SCADA . |
![]()
The Troubleshoot View selection, shown below, from the Diagnostics tab in IoTWorX, is similar to the functionality provided by ICONICS TraceWorX utility within its GENESIS64 HMI/SCADA suite. It allows users to view any existing troubleshooting logs configured through Troubleshoot Setup.
Troubleshoot View
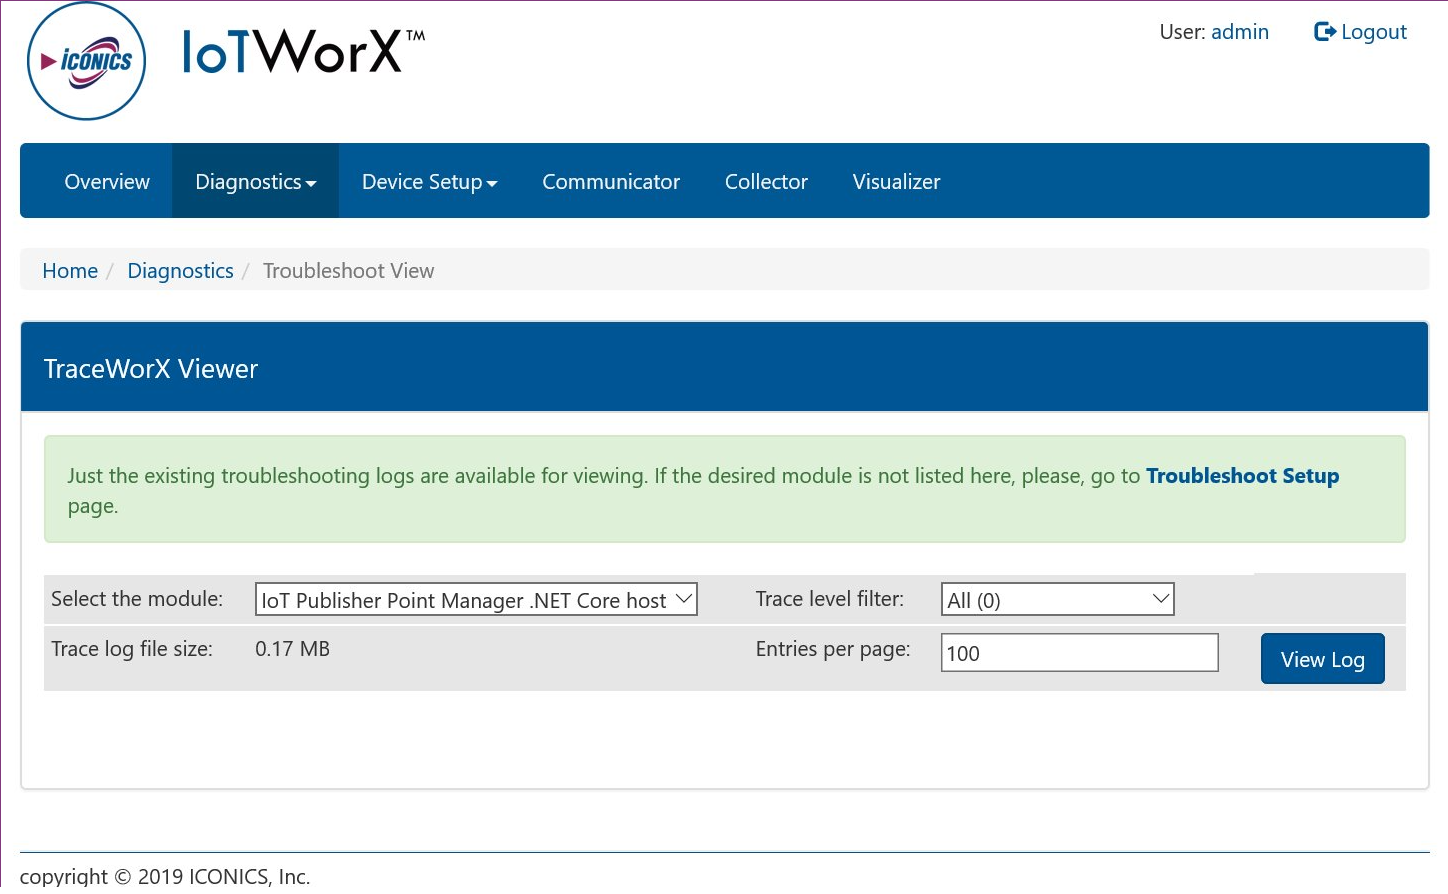
Note: Just the existing troubleshooting logs are available for viewing. If the desired module is not listed on this page, you will need to go to the separate Troubleshoot Setup page.
On this page, you will be able to Select the module that you wish to view. Once selected, you can set the Trace level filter via the nearby pulldown menu [selecting from either None (1000), Severe Error (900), Error (800), Warning (700), Normal (600), Debug (400), Debug Verbose (100), or All (0)]. The Trace log file size, shown below the module selection pulldown provides the most recent size of the log file in megabytes. You can also set the number of Entries per page in the nearby text entry field. Once you have completed these settings, click on View Log.
See Also: