![]()
![]()
This information is intended to give users a quick start guide on configuring and running reports using ReportWorX64. Microsoft Excel must either be installed on your ICONICS server or on another system that also has ReportWorX64 Express installed. The example assumes you are running the sample Hyper Historian and ReportWorX64 configurations.
ReportWorX64 is the report generation engine of GENESIS64 and the ICONICS Suite. Users configure report templates in Excel, using the same add-in as in ReportWorX64 Express, upload the templates to the ReportWorX64 server, and configure the reports to run on schedule or on demand. Finished reports can be delivered in a variety of ways including email, SMS, and file copy, or can be stored in the ReportWorX64 server to be retrieved on demand.
Microsoft Excel is required to configure templates, but the ReportWorX64 server itself does not need them to generate reports. Templates can be configured on a remote development system and uploaded when required. Different versions of templates can be stored on the server and downloaded as necessary to make updates.
To build a report template that can be uploaded to Workbench, data points and parameters must be added to an Excel spreadsheet. This will be populated with real data when the report is executed.
This example will guide you through creating a template that displays the last five hours of Hyper Historian data from the time the report has run.
For best results, make sure Hyper Historian is started on the ICONICS server and is logging data.
Open Microsoft Excel on a machine with ICONICS Suite, GENESIS64, or ReportWorX64 Express installed.
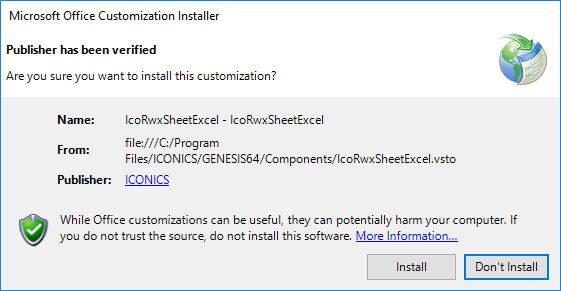
You may see a Microsoft Office Customization Installer. If you do, click Install.
Figure 1 – Microsoft Office Customization Installer
Open a blank workbook.
If the ReportWorX64 ribbon is missing, follow these steps:
Close Excel.
Go to Start > ICONICS Tools > ReportWorX Express Manager.
Make sure Enable ReportWorX Express Excel plugin is checked.
Select OK.
Start Excel.
If the ribbon is still missing, go to File > Options.
Select Add-ins.
Look for the IcoRwxSheetExcel add-in in the list.
If it appears in Disabled Application Add-ins, go to the Manage dropdown and select Disabled Items.
Select Go.
Select the IcoRwxSheetExcel add-in and enable it.
If the IcoRwxSheetExcel add-in appears in the Inactive Application Add-ins list, go to the Manage dropdown and select COM Add-ins.
Select Go.
Check the box for IcoRwxSheetExcel.
Select OK.
The ReportWorX64 ribbon should now appear. If it does not, contact technical support.
Go to the ReportWorX64 ribbon.
The ReportWorX64 add-in starts as disabled. If it is disabled, all buttons will be grayed out except Quick disable. To enable the add-in, select Quick disable.
If your Excel is remote from your ICONICS server, select FrameWorX and configure your FrameWorX server location. Restart Excel to have the changes take effect.
Select a cell in the sheet to activate the add-in.
Select Parameters.
In the table, select Click here to add new item.
For Display Name, enter Now.
Optionally, enter a description.
For Parameter type, choose Automatically evaluate a date and time.
The Date Type should be set to Today.
Add a second parameter.
For Display Name, enter 5HoursAgo.
Optionally, enter a description.
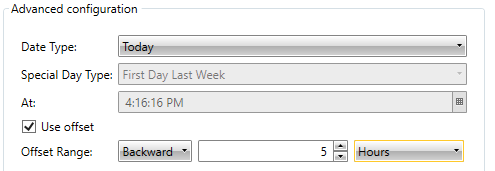
For Parameter type, choose Automatically evaluate a date and time.
The Date Type should be set to Today.
Select Use offset.
Set the Offset range to Backward and 5 hours.
Figure 2 – Configuration for 5HoursAgo Parameter
Select Save and close.
Select cell A1.
Add a data source to cell A1 by using Add > Data source in the ReportWorX64 ribbon or the context menu.
In the data browser, select My Computer > Historical Data > Hyper Historian > Configuration > Various Signals > Ramp Fast.
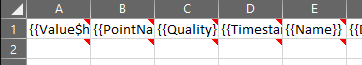
Select OK. Cells A1 through J2 should now appear with some text and notes (red triangles) that indicate it is mapped to a historical tag.
Figure 3 - Mapped Cells
Select one of the mapped cells.
Edit the data source by using Edit > Data source in the ReportWorX64 ribbon or the context menu.
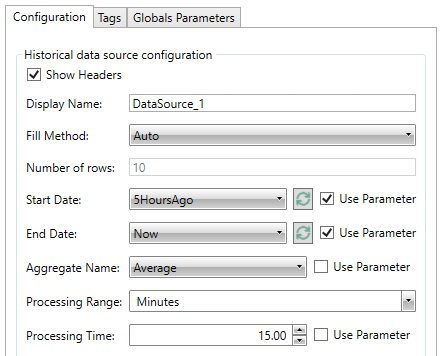
Make sure the Fill Method is set to Auto.
Next to Start Date, select the Use Parameter.
For Start Date, choose 5HoursAgo.
Next to End Date, select the Use Parameter.
For End Date, choose Now.
For Processing Range, choose Minutes.
For Processing Time, choose 15.
Figure 4 - Historical Data Source Configuration
Select Save and Close.
Save the Excel file with a name and location of your choosing, such as the Desktop. Remember the name and location for future steps.
Close Excel.
This section will guide you through uploading the file you just created to the ReportWorX64 server to use as a report template, then using that template in a new report.
If you were configuring your template on a remote machine, copy the Excel file to your ICONICS server.
On the ICONICS server, open Workbench.
Select Reports > Templates.
Add a new template by selecting Add Template from the Home ribbon or the context menu.
Name the template TestTemplate.
Optionally add a description.
Select Apply.
You will be prompted to select a template file. Choose the Excel file we created in the previous section.
Figure 5 – Selecting a Template File
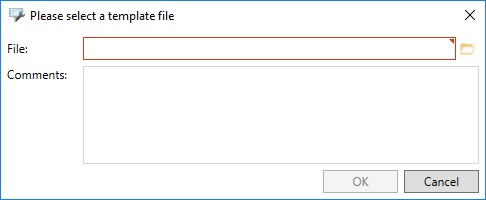
Optionally fill in a comment about this initial template version.
Select OK.
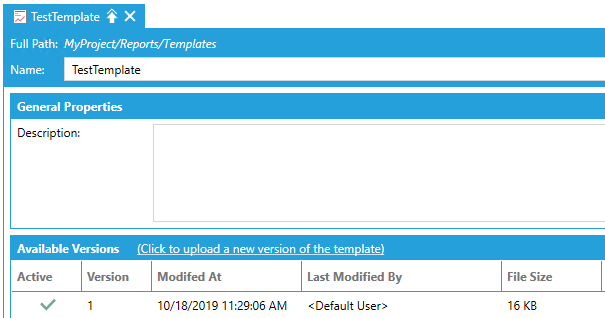
When the template has finished uploading there should now be one available template version. It should be active.
Figure 6 - Report Template Added in Workbench
Select Reports > Configurations.
If you do not already have a configuration in this folder:
Create a new configuration using the Add Configuration option in the Home ribbon or context menu.
Give the configuration a name.
Select Active Configuration.
Select Apply.
Select Sample Configuration, or the configuration you added in the previous step.
Add a new report using the Add Report option in the Home ribbon or the context menu.
Name this report, TestReport.
Select The report is enabled.
In the Report Template section, for Selected template, choose TestTemplate.
Select Apply.
In ReportWorX64, you can schedule reports to execute at a specific time or under specific conditions. Use Actions like workflows, schedules, and triggers to execute a report. You can also manually generate reports from GraphWorX64 using the ReportWorX Navigator and the ReportWorX Viewer. The generated report is saved in a runtime database that can be separate from the configuration database. Generated reports can be downloaded in different formats, including Excel, PDF, and HTML.
Redirector commands, including Send Email, Send SMS, File Copy, Print, and Web Publishing, can be executed when the report succeeds, fails, or any time it completes regardless of status.
This section will instruct you on using the built-in Reporting display to execute reports. (A later section will instruct you on how to build a similar display of your own that can be customized to your needs.)
Launch the built-in Reporting page by either:
Go to Start > ICONICS Tools > Reporting.
Open a blank display in GraphWorX64 and go into Runtime. From the Runtime ribbon, choose ReportWorX64.
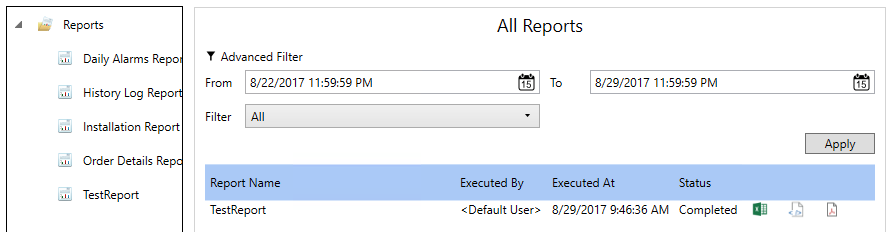
This will launch GraphWorX64 with the pre-built Reporting display. The tree on the left shows the list of currently configured reports.
Figure 7 - Reporting GraphWorX64 Display
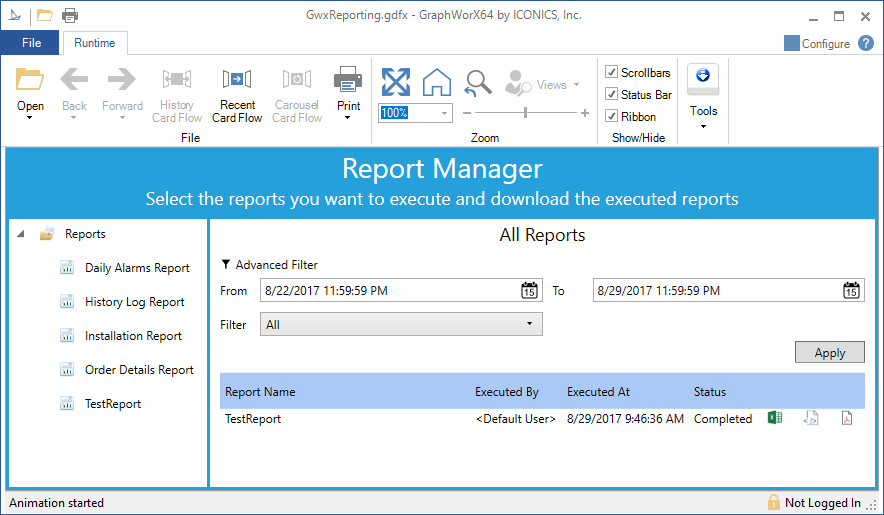
In the tree, select TestReport.
Select Execute.
Figure 8 – Generated Report
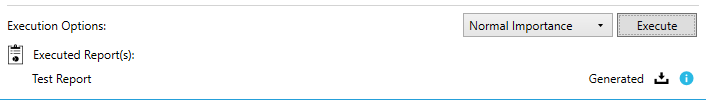
Once the report has been generated, the report window will update. Select the download icon next to Generated to download the report and view it.
Rather than using the pre-built reporting display, you can also create your own.
Open GraphWorX64 to a blank display.
Go to the Controls ribbon.
Add a ReportWorX Viewer and a ReportWorX Navigator to your display.
Select the ReportWorX Viewer.
Go to the Properties panel.
Set CommandingName (in the Misc – Commanding section), to rwxView.
Note: The CommandingName can be any text, as long as the same name is used in the relevant step below in place of rwxView.
Select the ReportWorX Navigator.
Go to the Properties panel.
In the Misc section, set both of these properties to rwxView:
LoadExecutedReportsComandingTarget
LoadReportCommandingTarget
NOTE: If desired, you could add two ReportWorX Viewers and use one for executing reports and another for viewing them. Give each ReportWorX Viewer a unique CommandingName and put the desired names into the different Load fields of the Navigator.
Go into runtime. This display should work exactly as the prebuilt Reporting display described in the previous section. (Follow the steps in that section to execute and download a report.)
Figure 9 - ReportWorX Navigator and Viewer
You can also execute reports using a button by writing a 1 to the @@Execute tag for the report.
If you still have the display from the previous example, go into configure mode. Otherwise, open GraphWorX64 to a blank display.
Add a button to your display.
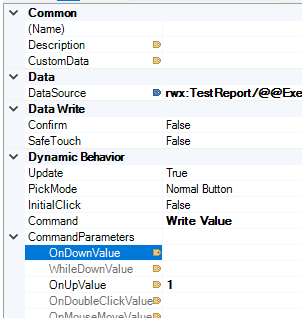
Select the button and go to the Dynamics panel.
Set the Command to Write Value.
For the data source, browse to My Computer > Reports > TestReport > @@Execute.
Set OnUpValue to 1.
Figure 10 - Pick Action to Execute Report
If your report has any parameters, you will need to supply them in the data source as part of the tag name. String values may be enclosed in double quotation marks, but this is not required. An example of an @@Execute tag containing parameters is:
rwx:Order Details Report/@@Execute<@param1=ALFKI>
NOTE: If you have configured your parameters to have separate display values you must use the non-display value in the tag path. For example, for the example Order Details Report you must use the CustomerID (like “ALFKI”) not the ContactName (like “Maria Anders”).
Go into runtime and push the button. This will tell the ReportWorX64 Server to execute that report. If you have the ReportWorX64 Viewer and Navigator on your display you can select your report in the Navigator and see the result in the Viewer.
You can use the @@Execute button to trigger a report from anywhere that can write a value, including Workflow, BridgeWorX64, and anything that can execute a Write Value command.
NOTE: The Run Report Command was designed to run 32-bit ReportWorX reports. It will not work for ReportWorX64 reports. Use the Write Value Command and the @@Execute tag for the report.
Along with the @@Execute tag, each report also has some other helpful tags that allow you to see the state of the report and tell when it has run.
@@Cancel – Writing a 1 to this value will cancel a report in progress.
ExecutedTicks – This value increments when a report has completed. This tag may reset if ReportWorX64 or FrameWorX is restarted. The actual value is usually not important, but you can tell that a report has completed by watching for this value to change.
LastExecuted – The time when the report was last triggered in local time.
LastExecutedError – If the last report failed, this will show the error. For a successful report, it will be blank.
LastExecutedInterval – The amount of time the last report took to execute.
LastExecutedState – A number that represents the state of the last triggered report. The states are:
-1: Unknown
0: Completed
1: Queued
2: Running
3: Failed
4: Ignored
LastExecutedUTC – The time when the report was last triggered in UTC time.
See Also:
About Reports in the Workbench