![]()
![]()
Open an active Hyper Historian (Classic) database and expand the folder called SPC Distribution Rules. This folder includes the default set of rule sets in Quality AnalytiX. Each rule set defines the tendencies your SPC tag values should or should not follow. For more information about creating or editing SPC distribution rule sets, see the SPC Distribution Rule Sets topic.
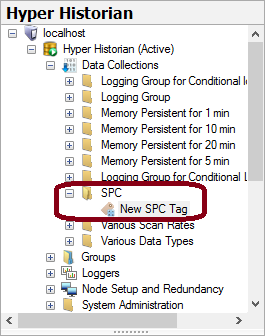
In Hyper Historian, expand the Data Collections folder and create a new folder called SPC. Once you have created this folder, right-click on it and select the + SPC Tag option to create a new SPC tag. The SPC Tag Configuration Dialog appears, and the project explorer contains the SPC folder and your new tag, as shown below:
New SPC Folder and Tag Appearing in Project Explorer
For more information about adding and editing SPC tags in Hyper Historian, follow the steps in the SPC Tags topic.
In the SPC Tag Configuration Dialog, configure the tag using the following options. For more details about the tabs found in this dialog, see the SPC Tag Configuration Dialog topic.
Give the tag a Name of Test.
In the "Properties" tab of the dialog, assign the following Data Point to this SPC tag: data:LogGrp.OPCUA.Ramp.
Select a set of Distribution Rules (such as Basic) for this SPC tag to follow.
Select a Collection Type of XBarS to summarize the sample values that this SPC tag measures.
In the Chart Properties area of the tab, set the limits of the XBar summary statistic to 110.00 (for a Hi Limit) and -10.00 (for a Lo Limit). Similarly, set the limits of the StdDev summary statistic to 10.00 (for a Hi Limit) and 1.00 (for a Lo Limit).
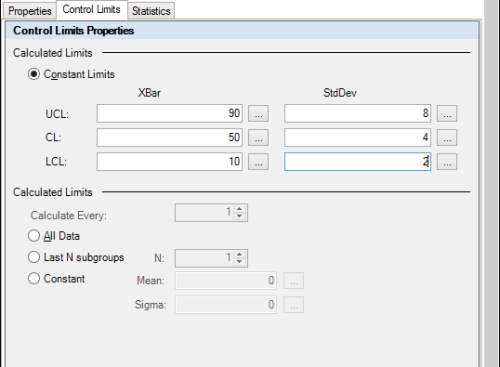
Move to the "Control Limits" tab of the dialog. In the Calculated Limits area of the tab, set the XBar values to 90 for UCL, 50 for CL, and 10 for LCL. Set the StdDev values to 8 for UCL, 4 for CL, and 2 for LCL. The following image shows the completed configuration on this tab.
Sample "Control Limits" Configuration
Move to the "Statistics" tab of the dialog. In the Process Capability Ratios area of the tab (near the right-hand edge), enable the check boxes next to Cp, Pp, Mean, Sigma, Avg, and StdDev.
Click Apply to save the changes you have made to this SPC tag.
Make sure that the Services traffic light that appears in the Home ribbon is green before continuing.
Quality AnalytiX is a Statistical Process Control solution which is flexible enough to apply to any quality monitoring application, yet simple to configure and deploy. It offers an extensive set of SPC calculations, control charts, portal dashboards, and standard quality reports that can be applied in a variety of combinations to help pinpoint quality or production issues. When combined with GENESIS64 it can also generate an alarm in case of rules violation.
The following shows how to view data which was processed by the Quality AnalytiX engine. You can view the data in form of:
GridWorX64 Viewer charts
Process points
ReportWorX Express reports
GenEvent Server messages in an AlarmWorX64 Viewer
GridWorX64 Viewer allows you to analyze the SPC data in the form of histograms or control charts that highlight samples which violate rules and provide tooltips to explain the violations. Tooltips of the samples show the alarm message for the violations.
Figure 1 - SPC Control Chart and Histogram in GridWorX64 Viewer
Insert a GridWorX64 Viewer into a GraphWorX64 display and double-click on it to enter the configuration dialog.
Figure 2 - Select SPC Control Chart
Right-click on the tab and select Add SPC Chart Wizard, as shown in Figure 2.
Figure 3 - Wizard
The Add SPC Wizard will open up as shown in Figure 3.
Click on the ellipsis [...] button and browse for your data source.
The Data Browser will open. Select the Hyper Historian SPC folder.
Figure 4 - Select SPC Data Source
NOTE: When selecting your data you need only select the folder of your configured SPC tag. You do not need to select any of the specific items in this folder.
Set the Collection Type to the same collection type as per the Hyper historian Configuration and click �Next�.
On the next wizard screen, set a title for the data and set the limits for the chart and click �Next�.
Specify styles of your charts to see the rules violating samples and click �Create�, this will create the SPC Charts in GridWorX64 Viewer configuration.
NOTE: Two charts will be created � primary showing Average and secondary showing Range (Data source path of each chart is automatically adjusted to point to proper data).
To add a SPC histogram just follows steps for setting up SPC Charts and, in the first wizard screen, check the �Show Histogram Chart� checkbox.
NOTE: Three charts will be created � SpcPrimary showing Average, SpcSecondary showing Range and Statistics with Histogram Chart (Data source path of each chart is automatically adjusted to point to proper data).
NOTE: You can delete any created chart if you don�t need it.
You can browse for any of the SPC data as for process points. Use the Data Browser in the same way as shown in the previous section about browsing SPC data in GridWorX64 Viewer. You can use this data in your graphics or smart tiles.
NOTE: To see desired process capability ratios in the Data Browser, you need to properly configure your SPC tag in Hyper Historian.
Figure 7 - Browsing for Process Point Data Source to Present SPC Data
Figure 8 - Using SPC Data in Smart Tiles
NOTE: For more info, see Smart Tiles.
You can also create reports based on your SPC data using ReportWorX Express. When using ReportWorX Express you can take advantage of the option to report SPC data.
NOTE: For more info, see Welcome to ReportWorX Express.
Open Microsoft Excel.
Navigate to the ReportWorX64 tab.
Click on the Quick disable button.
Right-click on a cell. Select Add Data source, as shown below.
Add > Data source
Browse for your SPCTag\Average in the Data Browser as shown below.
Browse for SPCTag\Average
To see data, click on the Download Data button, which will also bring up a Report Log similar to the one shown below.
After Clicking the Download Data Button
The rule violations are posted as event messages in ICONICS GenEvent Server. You can view them in AlarmWorX64 Viewer.
NOTE: For further information about AlarmWorX64 Viewer please read the appropriate product documentation.
Open GraphWorX64 and insert an AlarmWorX64 Viewer. Double-click the control to open the configuration dialog.
Subscribe the control to the Event Logger.
Figure 10 - Subscribe to ICONICS GenEvent Server
Click the Edit Fields of the subscription button in the Add/Remove Event Points section of the Source tab and make sure that you display the COMMENT field for GenEvent Server Simple events.
Figure 11 - Show Comments for Events
In the Columns tab, you should make sure that the Comment column property Is visible is checked. At a minimum, you should be showing the Time/Date, Description and Comment columns.
Go to runtime in order to view the rules violation. You can apply any filter or grouping as usual in AlarmWorX64 Viewer.
Figure 12 - SPC Limit Violations in AlarmWorX64 Viewer
NOTE: Comments always start with a P or S character depending on whether the Primary or Secondary Control limit was violated.
See Also: