Configuring TraceWorX64
GENESIS64 contains a diagnostics tool called TraceWorX. It is designed for system integrators, OEMs, and customers who want tools for their own troubleshooting and diagnostics.
TraceWorX tracks the runtime activity for each GENESIS64 application and logs the runtime data to a log file based on user-configured trace levels. The log file provides a thorough, color-coded report detailing all activity for the application, including the time, date, severity level, and description of the event or problem.
This document will describe how to turn on TraceWorX to log information about the application in question.
Configuring TraceWorX
- Launch TraceWorX via the TraceWorX button in the Tools ribbon in the Workbench (or as a separate application via C:\ProgramData\Microsoft\Windows\Start Menu\Programs\ICONICS\Tools\TraceWorX.lnk or C:\Program Files\ICONICS\GENESIS64\Components\IcoTraceConfiguratorApp.exe).
- It will launch the Trace Configuration view (the view below is TraceWorX running within the Workbench).
Figure 1 - TraceWorX Configuration
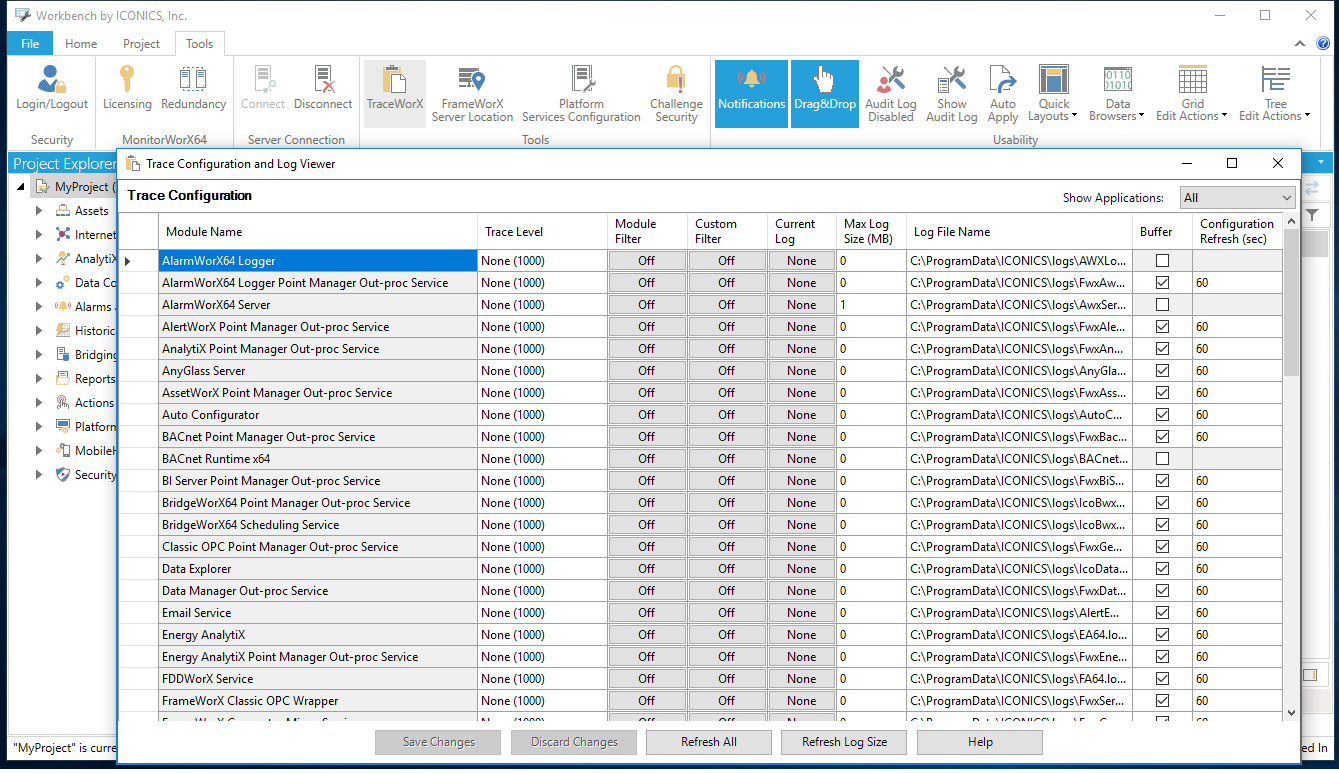
- By default, tracing is disabled for all the applications.
- You can locate the Module Name in question, and click the “None” button under the Trace Level column to set the trace level from the drop down menu.
- You can set the tracing level to “All”, which will log everything. However, this may slow down your system a bit. You may turn the tracing level to something “low” such as “Error”. This will have less of an impact on your system.
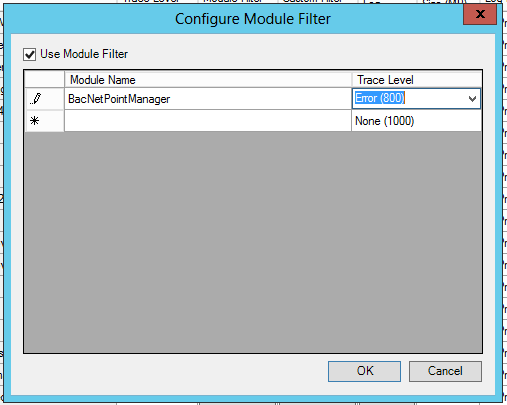
- You can set a Module Filter. Clicking in the Module Filter row opens the Configure Module Filter window, which allows you to select specific modules to filter (either exclude or include) as part of the trace of the selected Module Name.
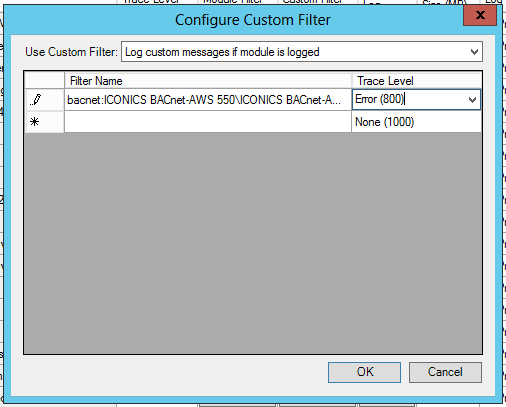
- You can set a Custom Filter. Clicking in the Custom Filter row opens the Configure Customer Filter window, which allows you to: Log custom messages if module is logged, Log custom messages only, Log custom messages and module messages, Log all custom message is module is logged.
- You can change the Max Log Size if you wish. A size of 0 MB means the file will grow indefinitely.
- You can also change the Log File Name and location for more convenience by clicking on the ellipsis button [...], which allows you to save the log file with your preferred name in your preferred location.
- For 'Buffer', when checked (set to 'True'), the file writes are buffered (the file remains open and flush is not called). When unchecked (set to 'False'), the file is flushed and closed after each trace entry is written. Buffering can possibly improve the performance of trace logging (depending on the frequency/quantity of what is being logged), but if an application crashes, you could miss any trace messages that have not been flushed yet.
- For Configuration Refresh, this sets the frequency at which TraceWorX checks for configuration changes. For example, if GraphWorX64 is already running and you change the trace level for GraphWorX64, if the configuration refresh is 60, it could take up to one minute (or less) for the change to take effect. Faster refresh rates will make applications respond more quickly to TraceWorX configuration changes, but can slow the system down more overall due to the extra overhead of having to the check the configuration for changes more often. One suggestion is to return this setting back to 60 when tracing is complete. It is important to remember that this is the rate at which it checks for ANY TraceWorX configuration change, even enabling/disable tracing. So even when all TraceWorX modules are set to Level=None, the modules set at a refresh rate of 10 would be re-reading their configurations every 10 seconds to see if tracing has been turned on. The default value of 60 was chosen to have negligible impact on a running system when TraceWorX is not being used.
- Select Save Changes when at the bottom when you are done configuring tracing for the particular application.
- You can now close out of the Trace Configuration viewer and return to it at a later time to view the logged data.
- Run the application to reproduce the error, or for a period of time.
- When you return to the Trace Configuration and Log Viewer, or use the Refresh Log Size button, you will see it has changed from “None” to a size of 0 MB or greater.
Figure 2 - Options Available after Tracing Started
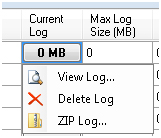
- Clicking on the size of the Current Log will show a drop down menu that will allow you to View the Log, Delete the Log, or Zip the Log files.
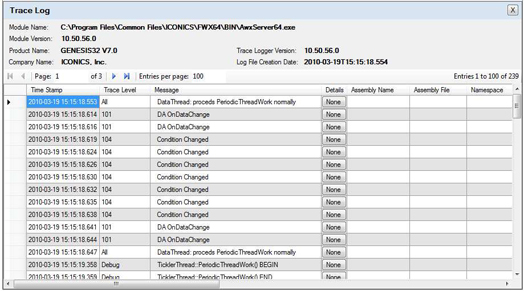
- Selecting View Log will display the data currently stored in the log file.
Figure 3 - Viewing the Trace Log
- Once you have reproduced the error, you should turn off tracing for that application.
See also:
TraceWorX
Tracing Diagnostics and Troubleshooting