|
|
The features on this page require a GENESIS64 Advanced license and are not available with GENESIS64 Basic SCADA . |
|
|
The features on this page require a GENESIS64 Advanced license and are not available with GENESIS64 Basic SCADA . |
ReportWorX 365 is a new app for Microsoft’s Office platform that runs in Excel Online in Office 365 or Excel 2013 SP1 (or later versions) running in Microsoft Windows, iOS or Android platforms.
It allows users to easily access real-time and historical data from any ICONICS application, including GENESIS64™, Hyper Historian™ and the AnalytiX® suite. With ReportWorX 365, users can configure and view reports related to industrial processes quickly and easily. In addition to gathering Big Data, users can also filter that data and perform advanced analytics on it using Microsoft’s business intelligence tools such as Power BI, Power View and Power Query, as well as Azure-based analytics services such as Azure Machine Learning.
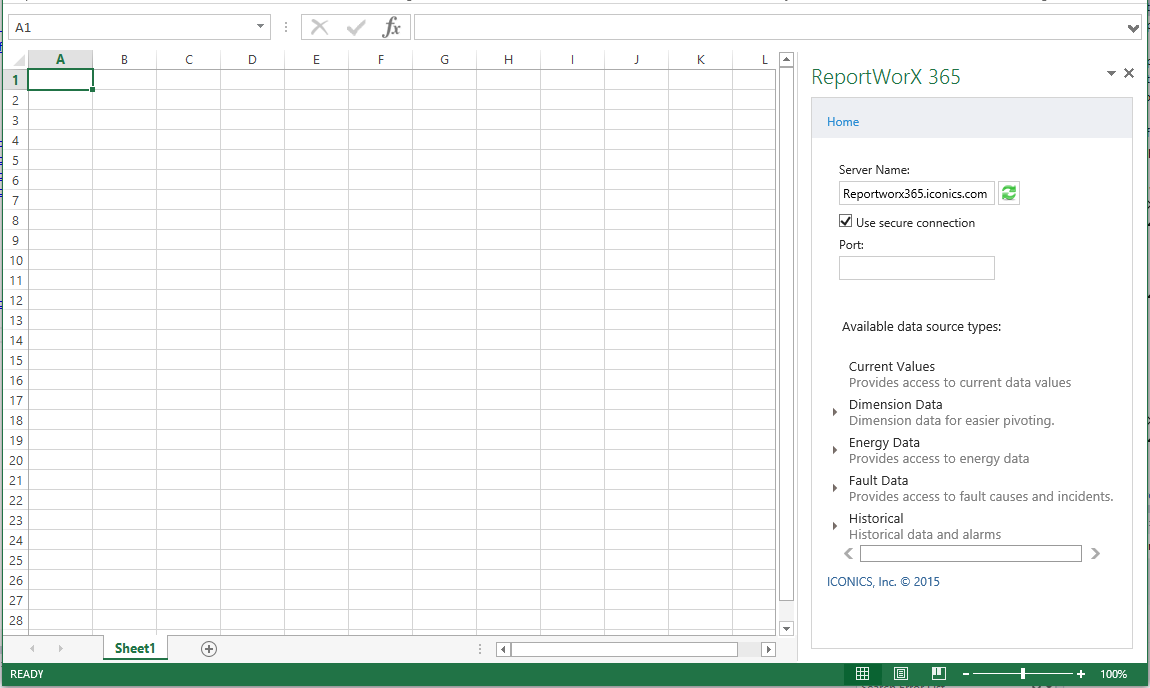
ReportWorX 365 Shown Within Microsoft Excel

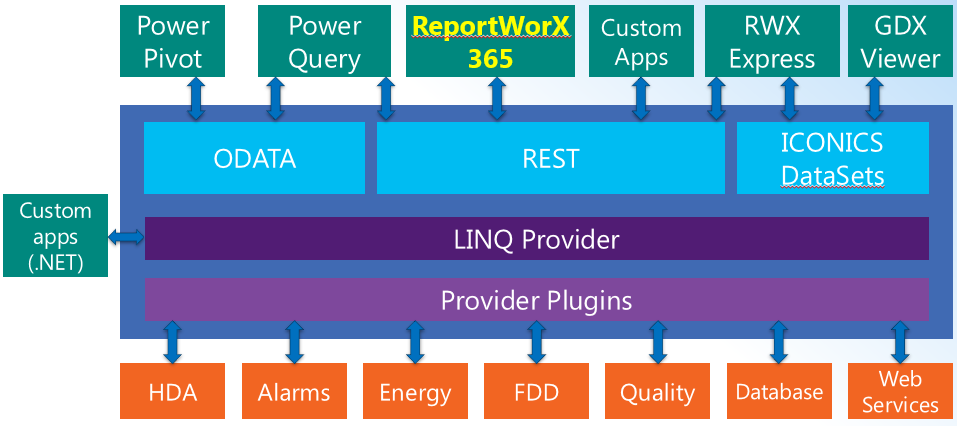
ReportWorX 365 Within Data Architecture

According to Microsoft, “Apps for Office are solutions that carry a light footprint and use Web standards-based technologies such as HTML5, JavaScript, CSS3, XML and REST APIs. Apps have a light footprint because they don’t actually install on the computer running the host application, they run from a browser control in a secure app runtime environment, and that means they are easily maintained and updated.”
Data from ReportWorX 365 Inserted into an Excel Workbook
ReportWorX 365 combines data into summary statistics using a variety of aggregation methods, with integrated role-based security to ensure that users have access to the data that is most relevant to them. The intuitive point-and-click wizard interface within an Excel task pane allows users to easily select the data they wish to access, select a location within the spreadsheet to view the data, then include any filters they wish to apply to that data.
ReportWorX 365 differs from ICONICS' ReportWorX Express in multiple ways. It appears in a task pane app design. It can be side-loaded or installed from Microsoft's Office App Store. It's available for multiple platforms (Windows, iOS and Android). Fewer mouse-clicks are required for functionality. Data is exported to currently selected cells, without requiring users to select cell ranges. Column names are built dynamically. Data is exported as a table, making use of Excel's rich table formatting option. Exported data can be used in PowerQuery. Server-side and client-side paging allows for better performance.
Historical Data Reported in Excel Via ReportWorX 365
Simplicity was the main goal in the design of ReportWorX 365. The focus is on data import, providing a user interface for OData Connector endpoint. ReportWorX 365 helps users fill in parameters. Once the data is in Excel, it can be used to create Power Pivots, Power Views and more.
Current Values - (OPC Real-time Data) - Provides access to current data values
Dimension Data (dates, assets, etc.) - for easier pivoting
Energy Data - (Energy AnalytiX) - Provides access to energy data
Fault Data - (Facility AnalytiX) - Provides access to fault causes and incidents.
Historical - [HDA (Hyper Historian, TrendWorX64, AlarmWorX64)] - historical data and alarms
Quality Data - Provides quality data
See Also: