![]()
![]()
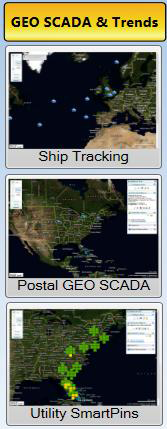
The SmartPin is a special type of pictographic data display that allows you to monitor and display the status of multiple data sources at the same time within a grouped set of indicators. A SmartPin consists of any number of SmartIcons in a shape that you configure. Each SmartIcon attaches to a data source and changes color depending on the values being sent from the data source. Data controls each SmartIcon's color and can even make the SmartIcon blink. If you want to see this, the GENESIS64 GenDemo has an example of working SmartPins in an EarthWorX map.
The visual nature of the SmartPin's SmartIcons helps users to immediately understand where a problem lies without having to analyze numbers or graphs. The SmartPin provides a simple, quick, and efficient way to identify conditions at a high level. SmartPins are ideal at providing a visual indicator for dense data in an overview when applied to geographically dispersed system. The visual indicator of color and blink control offers a user instant access to changing conditions. When Pick actions are defined, it is possible for runtime users to drill down to the underlying data and then make quick decisions on addressing any issues.
You should consider using a SmartPin when you want to visualize a set of information for each specific geographically dispersed asset. Your users will quickly learn what the specific SmartPin shape represents, and will be able to quickly react to problems.
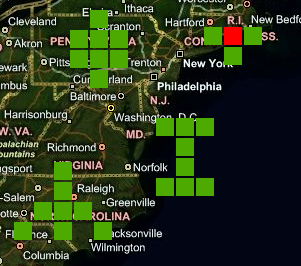
It is possible to create SmartPins which are quite different from one another, by creating various shapes and different numbers of cells, in order to create a meaningful object. The shape of the SmartPin could mimic the shape of the asset, or simply be a well-known shape meant to represent a specific set of information. Each SmartIcon cell that makes up a SmartPin is associated to a data source that provides a value; that value determines the color of the SmartIcon at any given moment in runtime. In the screen shot below, you can see when a value goes out of the normal range it turns red, indicating a problem. The warning is immediately visible even though the map displays 28 different data points.
A SmartPin with a Warning Condition
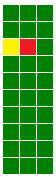
The shape of a SmartPin can also offer meaning to runtime users. The SmartPin below represents the ten floors of a building. Each horizontal row is a floor in the building, and each column represents alarms - in this case (from left to right) security alarms, fire alarms, and elevators. If a problem exists with any switch being monitored, the color changes, alerting the runtime operator.
|
|
Note: It is important, when choosing colors, to make sure the flashing alarm color strongly contrasts with the default color, which is commonly Green. While Red is a common flashing alarm color choice, it may not be easily noticed by operators who are color-blind. This is why using contrasting colors is more effective. |
The ten-by-three configuration is made up of 30 SmartIcons, each monitoring an individual switch for the building. You can add a Pick action to each SmartIcon so that the runtime operator can click on the SmartIcon to drill down to a more detailed set of information. In the illustration below, on floor number eight the fire alarms are sounding and an emergency door has been opened. Note how, with just a simple glance, the operator can see a condition unfolding and act quickly. The approach is simple, yet effective.
A SmartPin that monitors each floor of a ten-story building:
The following SmartPin, consisting of 14 SmartIcons, monitors a series of informational kiosks in a public building. The three kiosks displayed as black are currently offline. The light-green color shows three kiosks that are currently in use while the dark-green identifies kiosks that are online but idle.
A SmartPin that monitors kiosks in a public building:
![]()
|
|
Note: Each SmartPin can have its own unique shape. The SmartIcons in the pin don't have to be adjacent to each other, although they are in these examples. The SmartPins above reflect physical locations, but you can arrange the SmartIcons in any configuration that makes sense to operators who will be using them. |
There are countless ways you can use SmartPins and shape them for unique circumstances. For example, you can configure SmartIcons in a grid so that they appear, for example, in the same distribution format as sites in a geographic area. You can use SmartPins in an EarthWorX map to monitor sites around the world. You can use SmartPins for any of the following purposes:
To display sensor statuses for different subsystems in an automobile
For diagnostic monitoring of a patient in a hospital
For geographical monitoring of water pipes in a water system
For monitoring several toxic gas levels at different locations.
To create a SmartPin and work with it in GraphWorX or EarthWorX, see Configuring a SmartPin.
See also:
Controls Ribbon in GraphWorX 2D