![]()
![]()
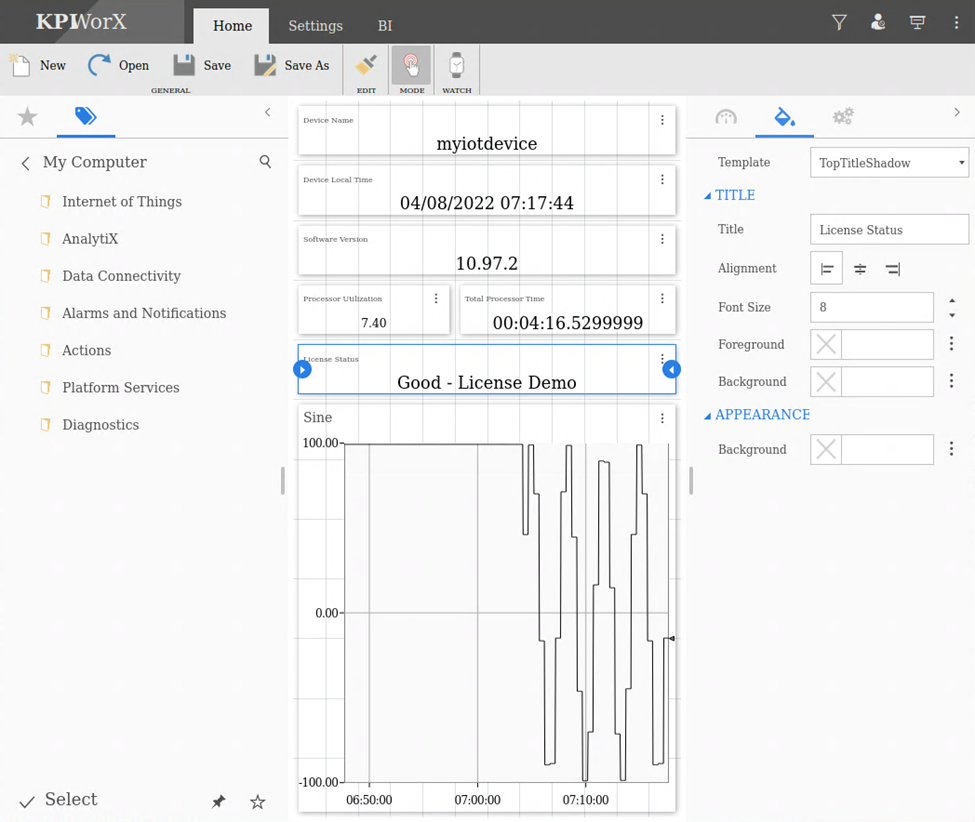
The IoTWorX™ Visualizer provides real-time visualization of KPI data, based on ICONICS KPIWorX™ responsive dashboards. Create and visualize dashboards on any device, remotely monitor and control assets, and drill down into enterprise-wide KPIs.
A new widget, the KPI Process Point, allows the IoT Visualizer users to write to points. Writing to points can be secured with the new security features for IoTWorX. See Support for ICONICS Security.
The Visualizer can now be secured. Security can be configured for an edge device to require users to log into the Visualizer to access certain functionality. See Support for ICONICS Security for more details about security in IoTWorX edge devices.
A new widget, the alarm viewer, allows Visualizer users to see GenEvents. See Support for GenEvents for more details about GenEvents in IoTWorX edge devices.
IoT Analyzer fault incidents are available as alarms.
To see to fault incident alarms in the IoT Visualizer, add an alarm widget and configure it to subscribe to AnalytiX > IoT Analyzer > your analyzer group name. The resulting alarm point should look like analyze:GroupName.
See Also: