|
|
The features on this page require a GENESIS64 Advanced license and are not available with GENESIS64 Basic SCADA . |

![]()
|
|
The features on this page require a GENESIS64 Advanced license and are not available with GENESIS64 Basic SCADA . |
![]()
1. Expand the "Internet of Things" node in the Project Explorer in the Workbench.
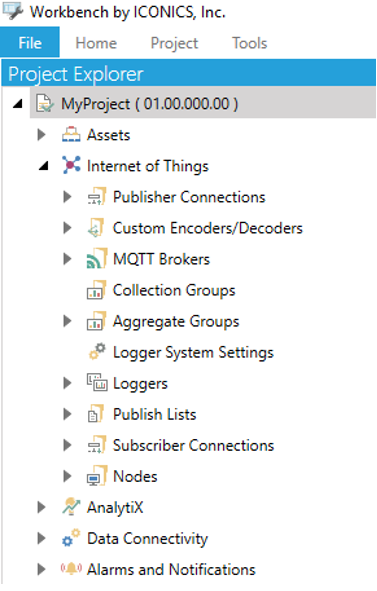
2. Go to "Publish List".
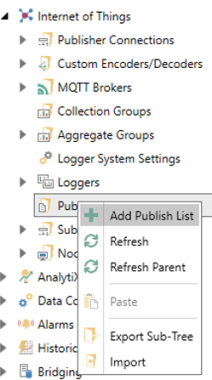
3. Right-click on it and then click on "Add Publish List".
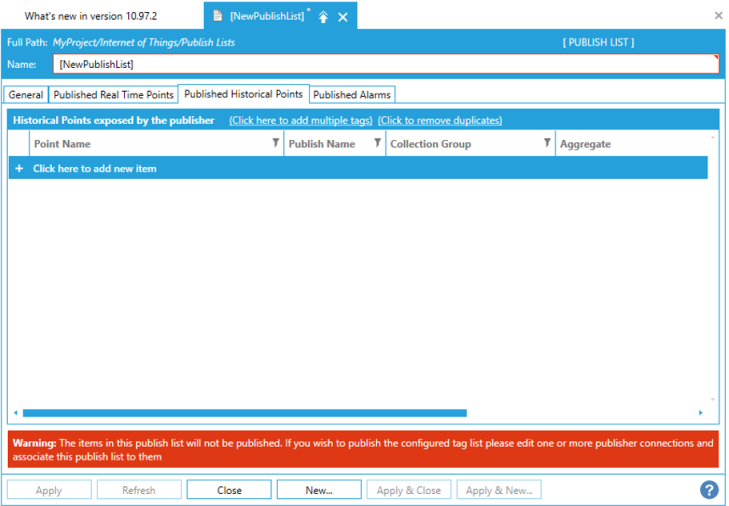
4. In the "NewPublishList" dialog, go to "Published Historical Points" tab.
5. If you want to add a new historical point:
a) Go to "Historical Data > Hyper Historian" in the Data Browser in the Workbench. You can also browse historical points from other sources.
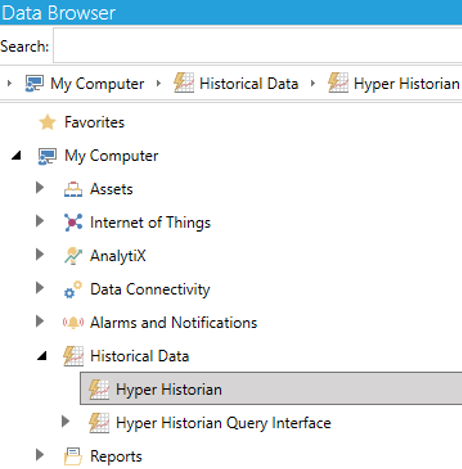
Make your choice and drag the historical point under "+ Click here to add new item".
A new line appears showing the "Point Name".
or:
b) Click on "+ Click here to add new item", and then enter the name of a new historical point.
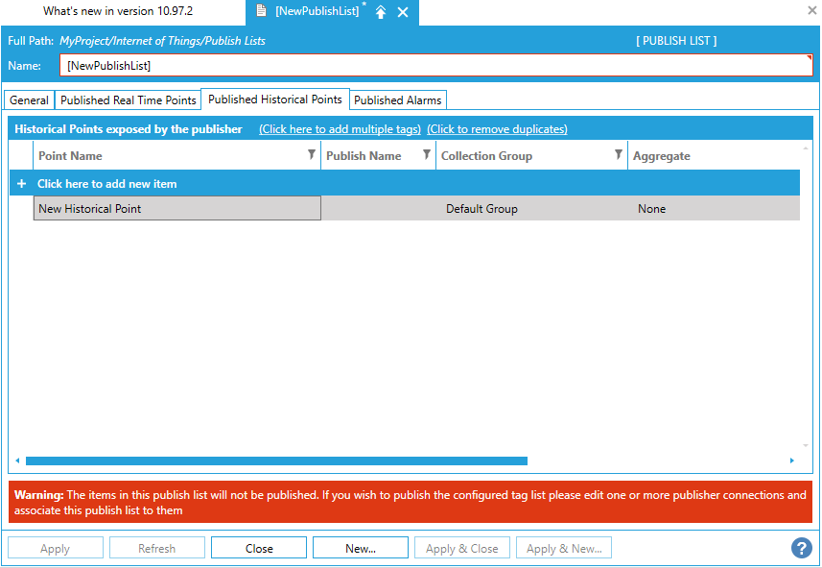
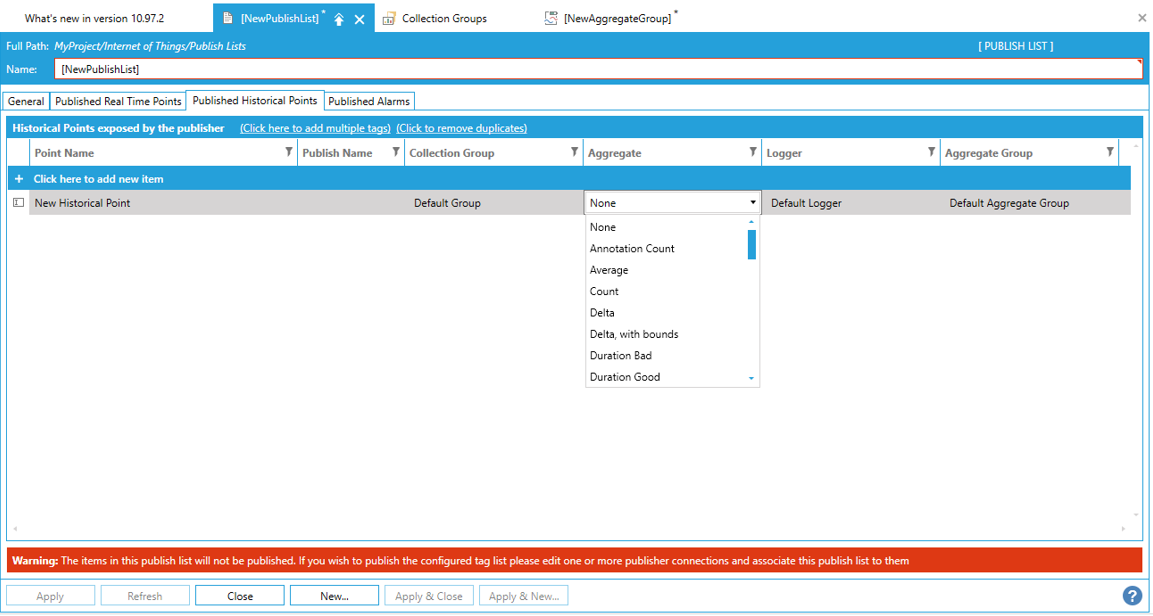
There are various settings that you can make in “NewPublishList > Published Historical Points” tab as you can see in the image above.
You can set:
1. Publish Name: You can enter a new name by clicking under "Publish Name". The point is published under this name into the cloud.
2. Collection Group: You can have multiple collection groups, such as "Collection Group 1", "Collection Group 2", etc.
If you want to create a new Collection Group:
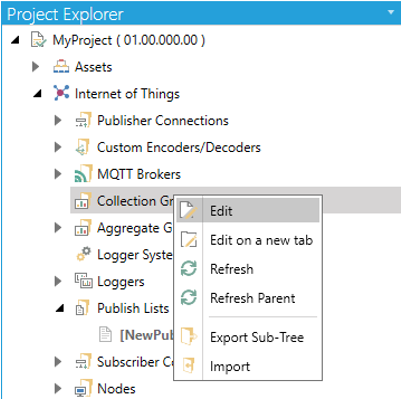
a) Go to "Internet of Things > Collection Groups" in the Project Explorer.
b) Right-click on "Collection Groups" and select "Edit".
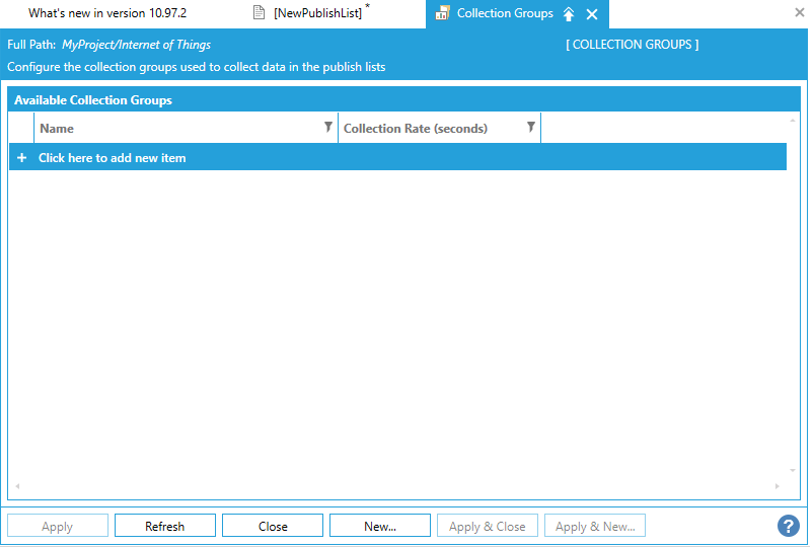
c) Go to "+ Click here to add new item" in the "Collection Groups" dialog, and enter the new name of a Collection Group.
3. Aggregate Group:
If you want to create a new aggregate group:
a) Go to "Internet of Things > Aggregate Groups" in the Project Explorer.
b) Right-click on "Aggregate Group", and select "Add Aggregate Group".

c) In the "NewAggregateGroup" dialog, enter a name of your new aggregate group.
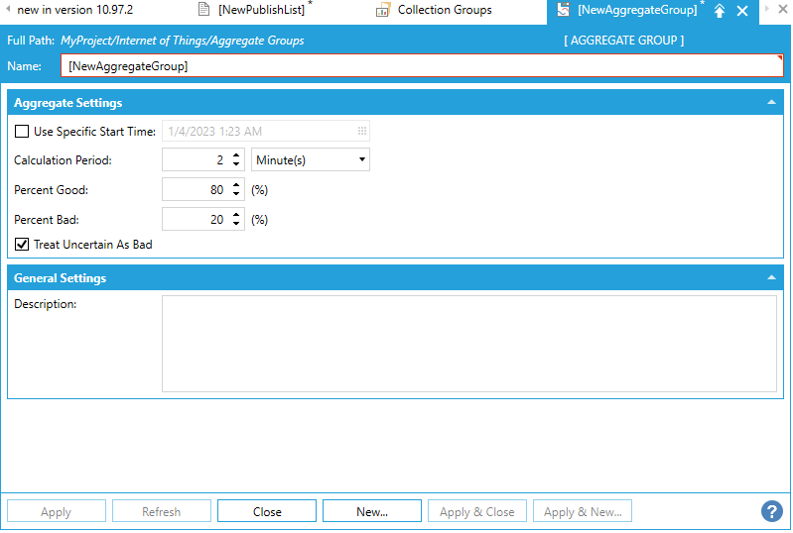
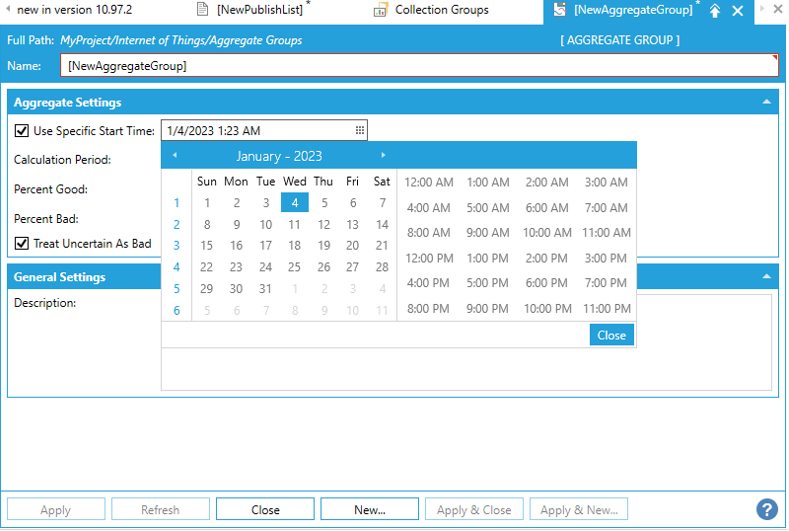
d) In "Aggregate Settings", you can tick "Use Specific Start Time", and select a start time by clicking on the calendar icon.
e) You can also enter the “Calculation Period” in Minutes, Seconds, Hours or Days by clicking on the dropdown menu.
f) Another settings are “Percent Good” and “Percent Bad”. Here, you can put a value in percent.
For example, if you set "Percent Good" on "80", it means that if more than 80% of samples are good, the aggregated value will be treated as good and vice versa.
If you set "Percent Bad" on "20", it means that if more than 20% of samples are bad, the aggregated value will be treated as bad and vice versa.
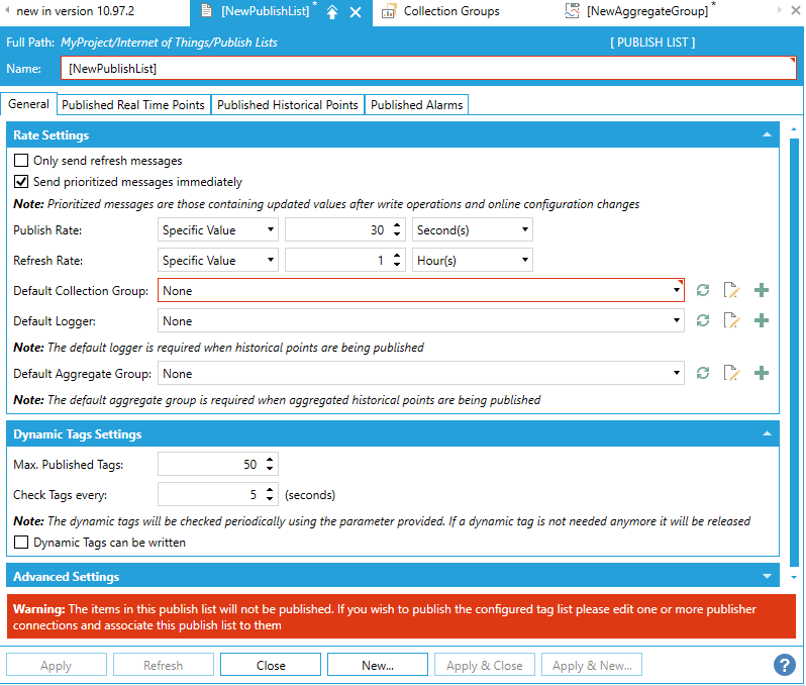
If you go back to “NewPublishList > General”, “Default Collection Group”, “Default Logger” and “Default Aggregate Group” are set to “None”. In this case, you cannot aggregate.
In “NewPublishList > Published Historical Points”, you can select how to “Aggregate” from the dropdown menu. We always store all values, but can filter them when they are published into the cloud.
In “NewPublishList > Published Historical Points”, it is also possible to make your “Logger” settings by clicking on the dropdown menu. You can make your selection of the “Logger” to be able to log the data.
The default logger is set to “None”. It means that you cannot log.
To be able to aggregate, you must specify the “Logger” by clicking on the dropdown menu.
If you want to change the “Default Collection Group”, “Default Logger”, and “Default Aggregate Group” in the “Published Historical Points” tab, go to “NewPublishList > General > Rate Settings” as shown in the image above, and make your changes.
To be able to consume historical points, you need to configure the IoT Subscriber.
In the General Settings, you need to enable "Collect the logged data retrieved with this subscription" checkbox. You also need to configure the Logger. Here, you need to enable "The logger is used by all subscriber connections to retrieve the collected data" checkbox.
Subscriber Logger Configuration

Subscriber Connection Configuration

In the runtime, you need to browse for a device that publishes the Historical Points (My Computer > Internet of Things > IoT Subscriber > <IoT Hub name> > <Device name> > History Data).
Under the History Data folder, you find all the published Historical Points.
Browsing Historical Points in Runtime

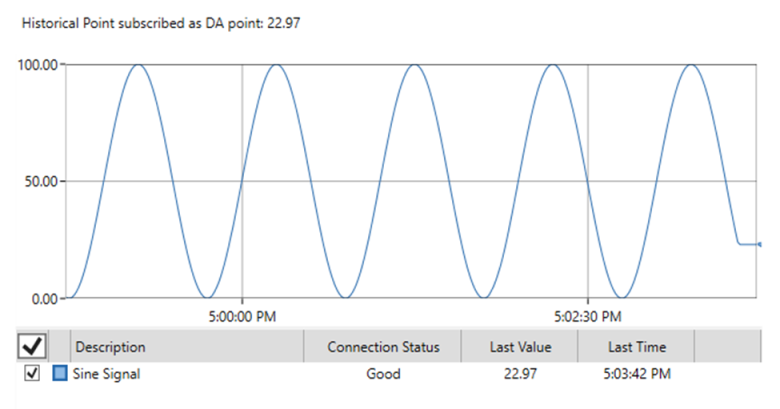
You can subscribe the Historical Point, e. g., in the GraphWorX using the TrendWorX Viewer.
Historical points also allow us to subscribe them as DA points. In this case, the DA point always shows the last received value.