![]()
![]()
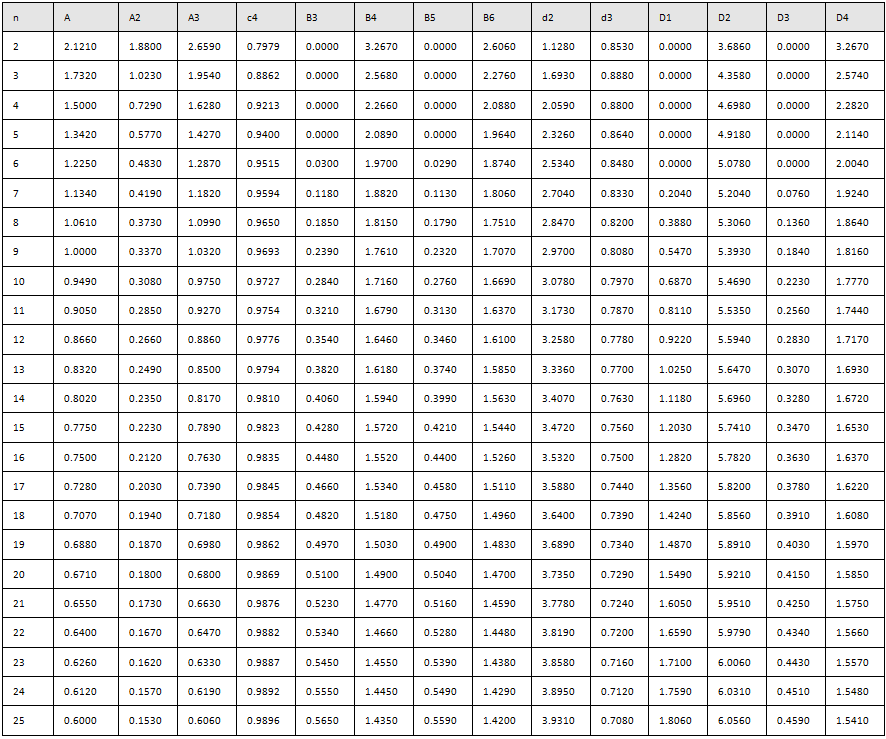
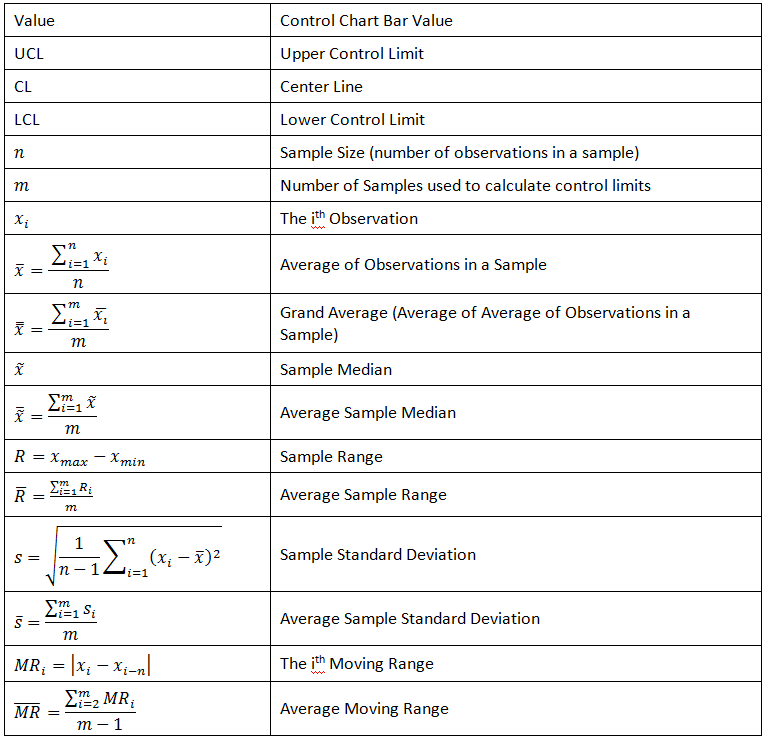
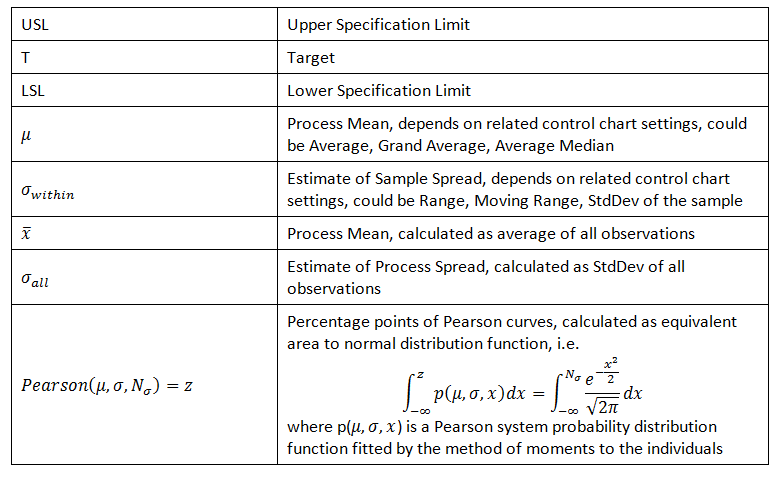
Quality AnalytiX offers many different types of statistics that you can view in control charts and reports. This topic presents the different variables and formulas used to calculate these statistics within the following tables:
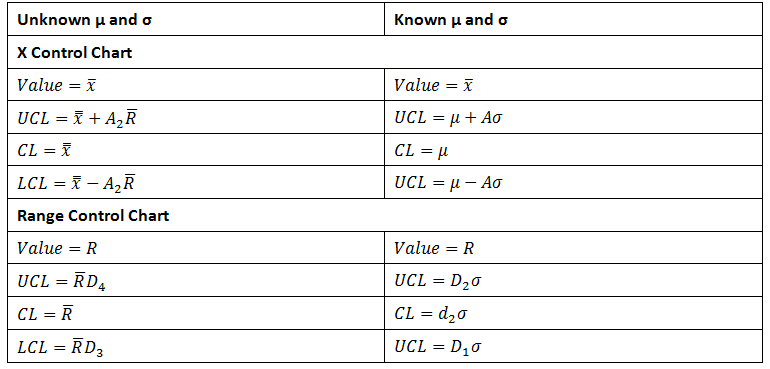
The following values apply to configurations in which you select the "XBarR" Collection Type in the SPC Tag Configuration Dialog.
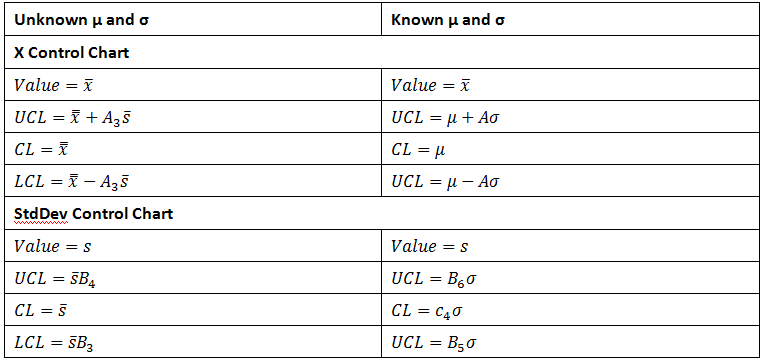
The following values apply to configurations in which you select the "XBarS" Collection Type in the SPC Tag Configuration Dialog.
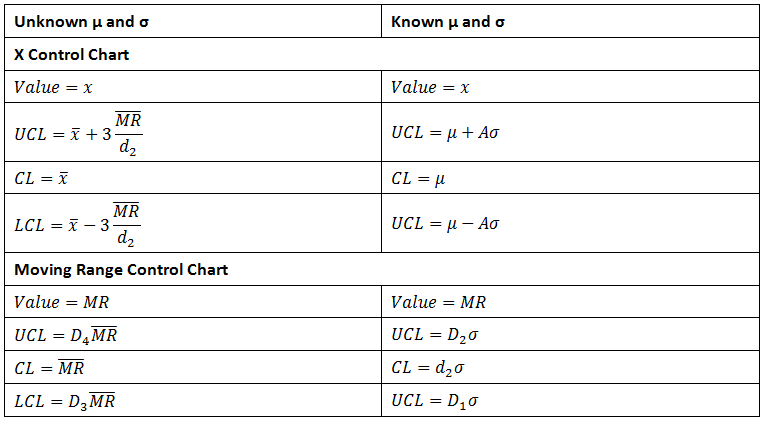
The following values apply to configurations in which you select the "XMR" Collection Type in the SPC Tag Configuration Dialog.
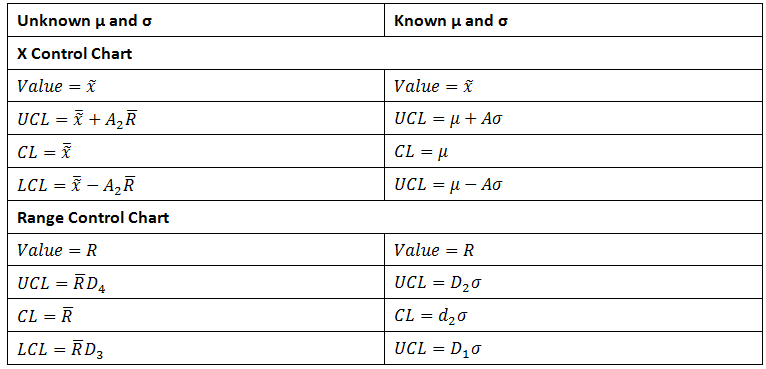
The following values apply to configurations in which you select the "MedianR" Collection Type in the SPC Tag Configuration Dialog.
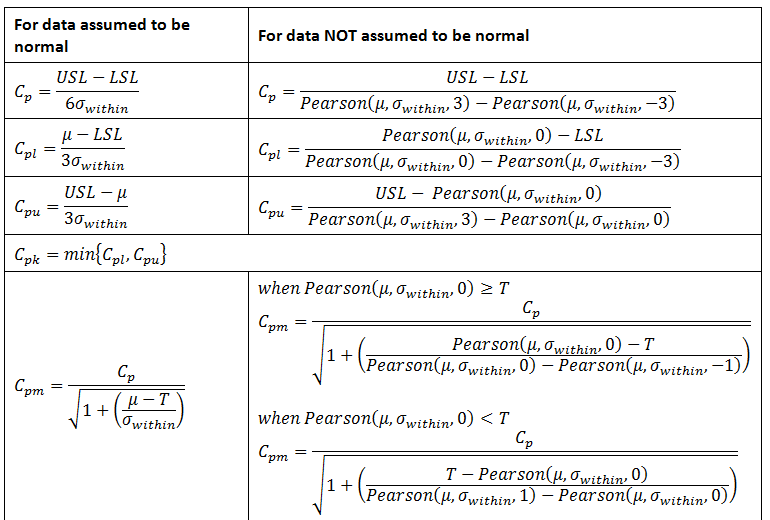
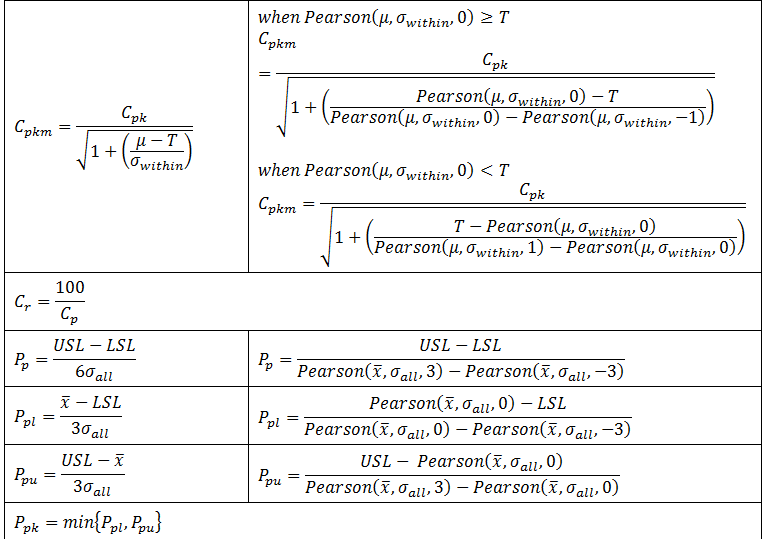
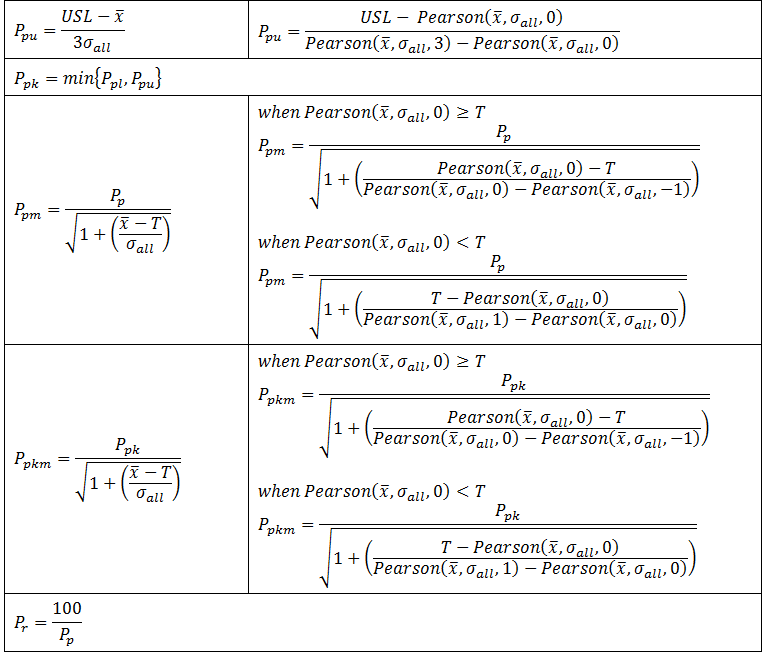
For configuration where you have enabled the check box next to Data is Normal in the Statistics tab of the SPC Tag Configuration Dialog, use the values in the left column of the following table. If you have not enabled this check box (and your plant data may not follow a normal distribution), use the values in the right column instead.
See also: