![]()
![]()
Hyper historian tag represents a single historical value, which can get data values from other parts of the system. It can subscribe to real-time updates (OPC servers), receives data from MergeWorX or entered by custom tools via historical APIs. Real-time part of the processing is always processed by the data collector component, while historical API accesses the logger component via FwxServer infrastructure.
To Create a Hyper Historian Tag:
Start the Workbench, then expand your project. Next, expand the Historical Data node to show the Hyper Historian node. Expand the Hyper Historian node to show the Data Collections node.
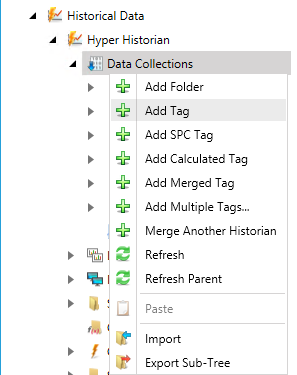
Right-click the Data Collection node in the navigation tree, or any of its sub-nodes, and select Add Tag, as shown in the figure below.
Add Tag from the Project Explorer
-OR-
Select the Data Collections node in the Project Explorer, or any of its sub-nodes, then click on the Add Tag button, shown below, in the Edit section of the Home ribbon in the Workbench.
Add Tag Button

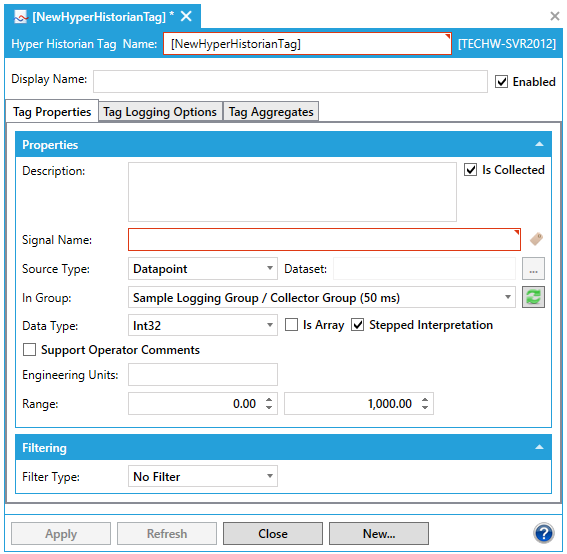
This opens the Hyper Historian Tag properties window, shown below, beneath the Project Details section in the Workbench. Enter a name in the Hyper Historian Tag Name text entry field. The name should be short. It is used as a part of the browse name and, for that reason, you want to keep it short. The Display Name field, not the name field, is where you want to provide lengthy detail so that the Name field is not long. Tags are logged with the browse name that you provided in the Name field, so you want to keep the name short.
Hyper Historian Tag Properties
Optionally, you can enter a Display Name which appears for the Hyper Historian tag in the Project Explorer. Use the display name to supplement the shortened tag name that you entered in the Name field. If a Display Name is not provided, the Name appears in the Project Explorer instead.
The Enabled button specifies whether data for the tag is logged. When disabled, any aggregate associated with the tag will not be logged either.
The Description field can contain a detailed description of several lines for the Hyper Historian tag. Use the description to provide a complete definition of the tag.
The Is Collected checkbox is selected by default. This means that the Hyper Historian tag's data is collected by the collector from a signal. However, if the tag's data is not collected using a signal, but is collected and written directly to the logger using some other means, such as a TrendWorX64 Viewer or a .CSV file via MergeWorX, de-select the Is Collected checkbox. As a result, the tag's Signal Name field becomes disabled, as does the Filtering field and (on the Tag Logging Options tab, described later in these steps) the Log to Disk options.
For the Signal Name field, select the signal (that is, the tag or point) to be collected by clicking the  button and browsing for the OPC tag whose data is to be collected. If you leave this field empty, an exclamation point icon will remind you that you have to enter one. (Note that this field is not used if the Is Collected checkbox is empty.)
Select a Source Type for the data signal associated with the tag using the provided pulldown menu. The signal can come from a Datapoint (real-time FrameWorX Client data source) or a Dataset (recommended for merging BACNet historical data) or Dataset Generic.
If you select Dataset, leave the Dataset field blank if the data set contains only one value or a default set of column names, or enter the user-defined name that appears at the end of each column name in the dataset (for example, if your data set includes columns named Value_test and StatusCode_test, enter "test" in the Dataset field). You can click on the ellipsis [...] button to open the Dataset Configurator or Dataset Generic Configurator.
For the In Group field, select the group in which the tag should appear within the configuration database. Click on the refresh button to load the current list of groups.
Select the Data Type from the Data Type drop-down list. Options include: Native, Boolean, Int8, UInt8, Int16, UInt16, Int32, UInt32, Int64, UInt64, Float32, Float64, String, Duration and DateTime.
The Is Array checkbox allows you to set if the data type is an array.
Put a check mark next to Stepped Interpretation to enable this feature if it is desired. Stepped Interpretation is used primarily during playback, for interpreting the tag’s data values. This feature is applied only if you request a value for a certain point of time (in the Log to Disk option on the Tag Logging Options tab). The returned value will be the nearest older value available. In general, if the data comes from a discrete signal such as an on/off switch (or a Boolean data type), put a check mark in the Stepped Interpretation check box; but if data comes from a sine wave or analog signal, leave the box empty.
You can optionally click a check mark in the Support Operator Comments check box to allow operators to comment on the signal in displays. Later, as the tag’s data values play or replay in the Trend Viewer, you may want to be able annotate the tag’s data values as you see them trending before you. For example, maybe you want to note an operator action that altered the data slightly or highlight a piece of data for analysis later. Putting a check mark in the Support Operator Annotations check box lets you do that. Such annotations are saved with the tag’s data in its logger file, which makes the annotations available in a replay, accessible to the Hyper Historian SQL Server Interface, and archived with the tag’s data.
Enter the Engineering Units.
Enter the Ranges for the High Limit and Low Limits in the provided text entry fields. The High and Low Limits are a value range exposed with every historical tag to its clients (e.g. TrendWorX64 Viewer can use it to set up ranges for a historical pen).
Optionally, you can select the type of Filtering to be used and enter the filter setting via the Filter Type pulldown menu. By default, No Filter is used.
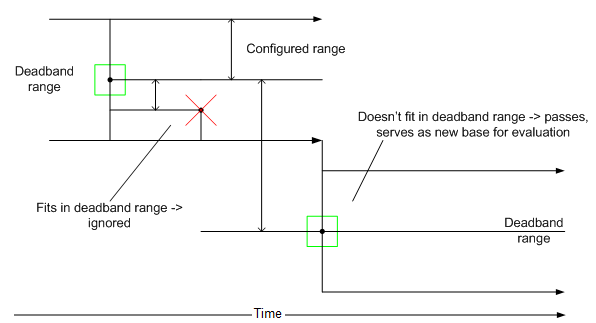
If you are using Deadband filtering, set the threshold as either an Absolute or Percent and enter the value in the text entry field.
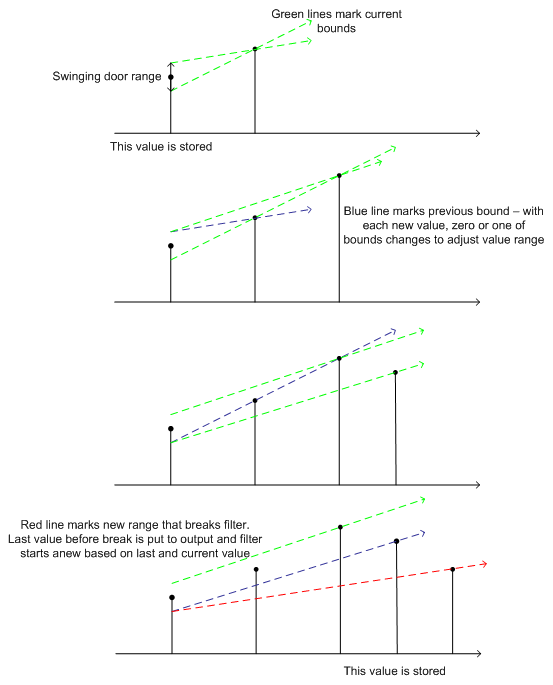
If you are using Swinging Door filtering, set the threshold as either an Absolute or Percent and enter the value in the text entry field. Then, set both the Maximum Period and Minimum Period in the nearby text entry fields (in milliseconds).
|
|
Note: Filtering options are not available if the Is Collected check box is empty. A tag's Filtering option is applied to data in the collector. If the tag's data is written directly to the logger, no filtering can be applied because the data never passes through the collector. |
Click the Apply button to enforce your selections for the Tag Properties tab.
Logging options allow to filter (reduce) number of incoming real-time values on the collector side. Filtering can be done in different ways – either by calculating aggregates (Avg, Min, Max) on different groups of data or by logging samples in the end of specified interval. Since this filtering is done on real-time values without possibility to access historical (logged) values, calculation period should be reasonably short (e.g. seconds or minutes). Calculation period is specified in the Collector Group form in the section Collection Parameters.
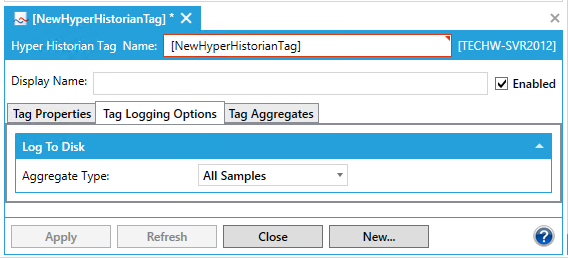
Go the Tag Logging Options tab. In the Log to Disk section, click on the Aggregate Type pulldown menu to select from All Samples, Max, Min, Avg, Std. Dev., Running Max, Running Min, Running Avg, Running Avg, Moving Avg, Totalizer or Most Recent On Time.
Tag Logging Options Tab
Unlike Tag Logging Options filter processing, aggregates are processed on the logger side. These calculations are using historical values received from collectors. Each aggregate can aggregate values from coming from single input, configured in this form. As such, re-calculation of aggregates is available (see System Settings section). Base aggregation parameters are defined in Aggregate Groups. Aggregate Groups can be created underneath each logging group. It supports all standard aggregates defined by OPC foundation in OPC UA specification, part 13.
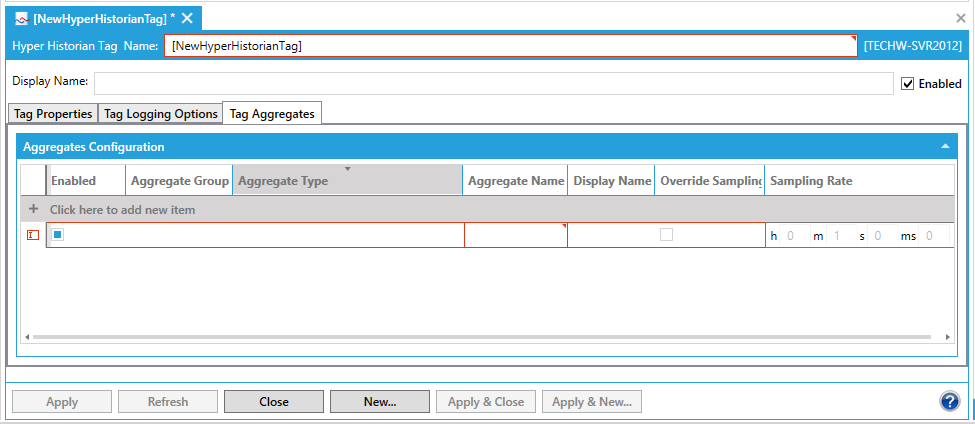
Go to the tag's Tag Aggregates tab. In the Aggregates Configuration section, click on +Click here to add new item. You can then click on the Enabled checkbox to enable that item. Click within the Aggregate Group cell, which allows you to select from the pulldown menu. In the Aggregate Type cell, use the pulldown menu to select from Interpolative, Average, Time Average (Interpolated Bounds), Sum, Minimum, Maximum, Minimum Actual Time, Maximum Actual Time, Range, Annotation Count, Count, Number of Transitions, Start, End, Delta, Duration Good, Duration Bad, Percent Good, Percent Bad, Worst Quality, Standard Deviation (N-1), Variance (N-1), Standard Deviation (N), Variance (N), Start (Bounds), End (Bounds), Delta (Bounds), Minimum (Bounds), Maximum (Bounds), Minimum Actual Time (Bounds), Maximum Actual Time (Bounds), Range (Bounds), Time Average, Total or Worst Quality (Bounds). In the Aggregate Name cell, it may auto-fill according to your previous settings, else you can enter a name in the text entry field. The same applies to the Display Name - as it may be auto-filled or you can enter a different display name in the text entry field.
Tag Aggregates Tab
Once you have completed setting your tag properties, click on Apply. Your new tag will appear in your selected location in the Project Explorer.
See Also:
Using the Data Collections and Groups Nodes