![]()
![]()
The Health Monitor Settings node in the FrameWorX provider tree explorer in the Workbench allows users to configure the inputs and rules for System Health Monitoring.
To Configure Health Monitor Settings:
In the Workbench, expand the Platform Services node and then the FrameWorX node.
Selecting the Health Monitor Settings Node in the FrameWorX Provider in Workbench
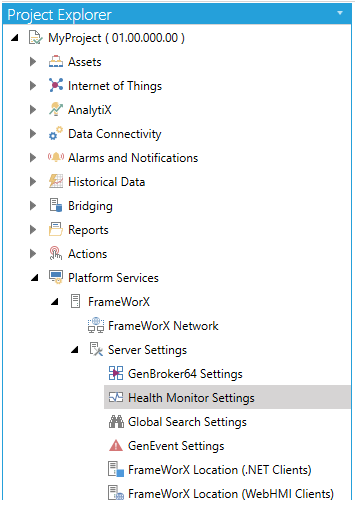
Double-click the Health Monitor Settings node.
-OR-
Select Health Monitor Settings, then click on the Edit button, shown below, in the Edit section of the Home ribbon in the Workbench.
Edit Button

This opens the Health Monitor Settings properties window in the right side of the Workbench, as shown below.
Health Monitor Settings - Data Inputs Tab
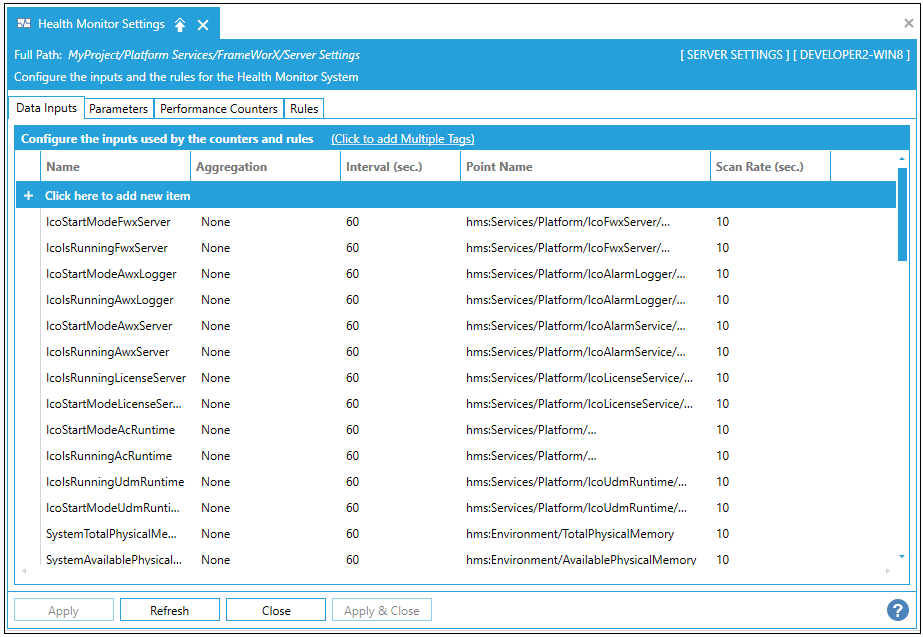
The Health Monitor Settings properties contains four tabs: Data Inputs, Parameters, Performance Counters, and Rules.
In the Data Inputs tab, click on "Click here to add new item". Enter a name for the Data Input in the Name text entry field. Click in the Aggregation field and you will be able to use the pulldown menu to select from either None, Minimum, Maximum or Time Average. Next, enter an Interval in the following text entry field. When you click within the Point Name field, you can enter a point name directly in the text entry field or click on the  button to open the Data Browser and navigate to your selected point name. You can then enter a Scan Rate in the last text entry field.
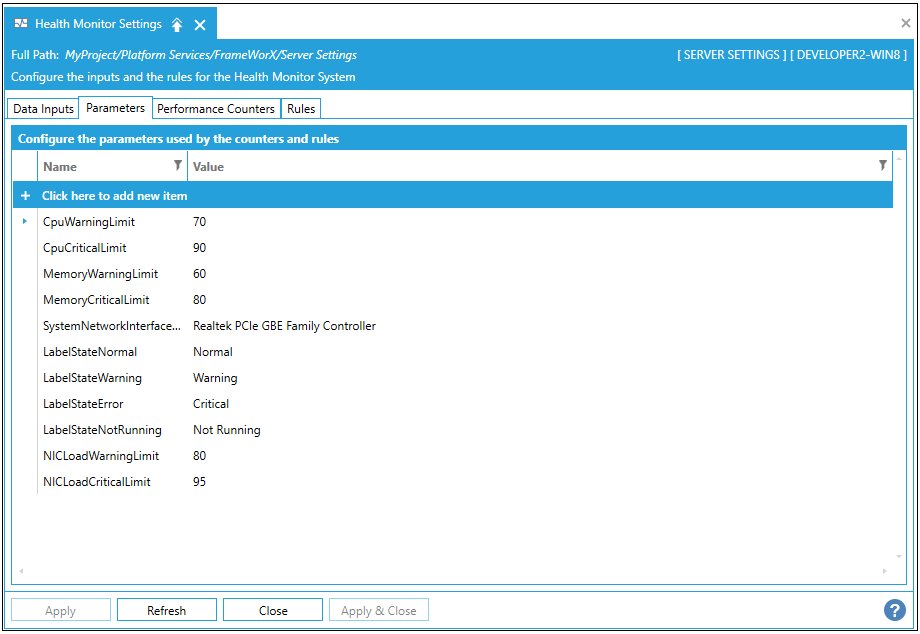
In the Parameters tab, you can enter a parameter Name and Value.
Health Monitor Settings - Parameters Tab
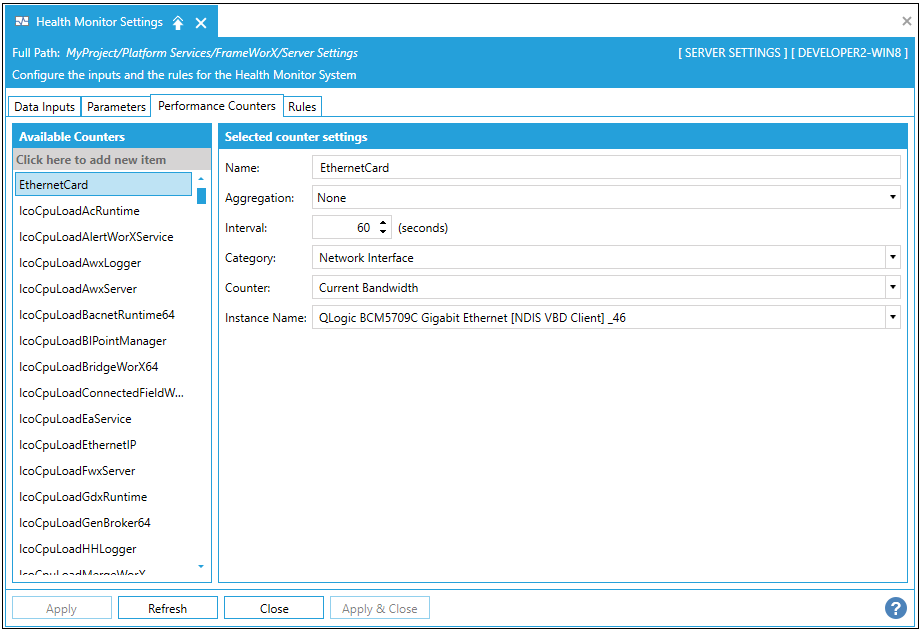
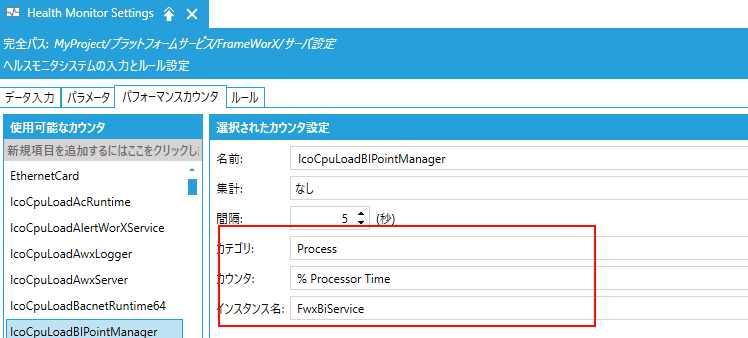
In the Performance Counters tab, click on "Click here to add new item". Enter a name for the Performance Counter in the Name text entry field. Click in the Aggregation field and you will be able to use the pulldown menu to select from either None, Minimum, Maximum or Time Average. Next, enter an Interval in the following text entry field. Click in the Category field and you will be able to use the pulldown menu to select from the list of categories. Depending on what you selected in the Category field, the Counter field will provide an additional pulldown menu for you to select from the list of counters. The last field is Instance Name, where you can enter this info into the text entry field or, depending on the Category/Counter, use the pulldown menu to select from the list of instance names.
Health Monitor Settings - Performance Counters Tab
![]() Note: All performance counters must be configured here in Health Monitor. Starting from version 10.97.2, the System Performance Counters, previously available in the data browser under Diagnostics / Control and Diagnostics / System Performance Counters, are no longer browsable due to excessive time consumption. They still work in existing displays but to be able to browse them, you have to configure them manually following the steps above.
Note: All performance counters must be configured here in Health Monitor. Starting from version 10.97.2, the System Performance Counters, previously available in the data browser under Diagnostics / Control and Diagnostics / System Performance Counters, are no longer browsable due to excessive time consumption. They still work in existing displays but to be able to browse them, you have to configure them manually following the steps above.
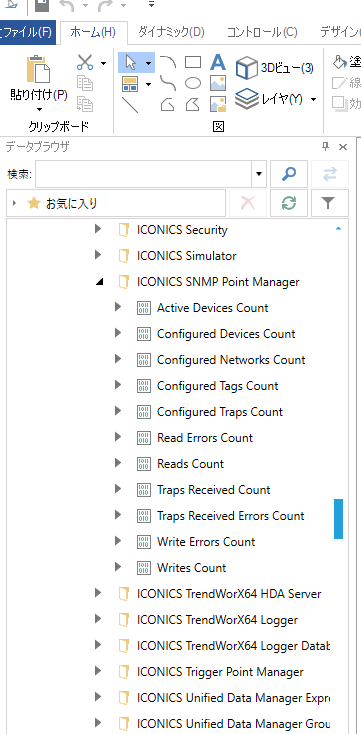
The configured counters will appear in the data browser under Diagnostics / Health Monitor, provided the Health Monitor Service is running:
Counters in the Data Browser

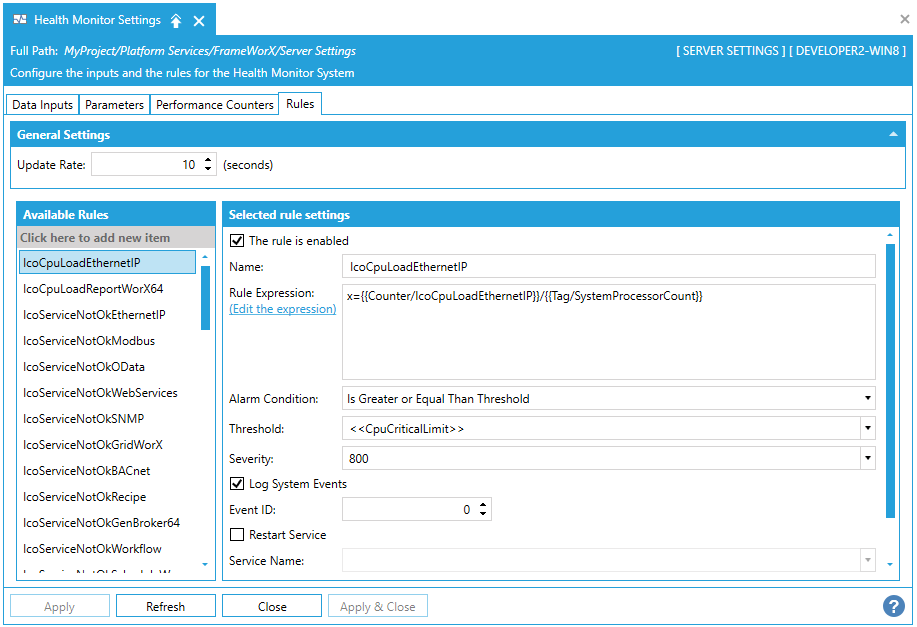
In the Rules tab, in the General Settings section, you can enter an Update Rate (in seconds) in the text entry field. In the Rules section, click on "Click here to add new item" to enter a new rule. Enter a name for the Rule in the Name text entry field. The Enabled field allows you to set, via checkbox, whether the rule is currently enabled (this is set as enabled by default). In the Expression field, you can enter an expression directly into the text entry field or click on the  button to open the Configure the expression window. [Once you have set your expression, click OK to return to the Health Monitor Settings.] In the Alarm Condition field, you can use the pulldown menu to select from: Is False, Is True, Is Greater Than Threshold, Is Greater or Equal Than Threshold, Is Less Than Threshold, or Is Less of Equal Than Threshold. You can then set a Threshold in the following text entry field. Next, you can set the Severity in the next text entry field. The Log System Events field allows you to set, via checkbox, whether to log the system events associated with the rule (this is set as enabled by default). The Restart Service field allows you to set, via checkbox, whether to restart a specific service (this is set as disabled by default). If the Restart Service checkbox is checked, this activates the Service Name field, where you can select the service to be restarted from the pulldown menu. Also, depending on if the Restart Service checkbox is checked and a service has been selected from the Service Name field, you can decide whether to Restart Immediately (via checkmark) or enter a Restart Time in the text entry field or click on the
  button to open the time picker window. The
  buttons allow you to move the rule within the list of rules.
Health Monitor Settings - Rules Tab
Once you have made your changes to the Health Monitor Settings properties, click Apply to save your settings, then Close to close the window.
GENESIS64 performance counters rely on the Windows performance counters infrastructure. During the installation, FWX performance counters are registered in the system and then they can be accessed as all other performance counters, using the Windows Performance Counters API.
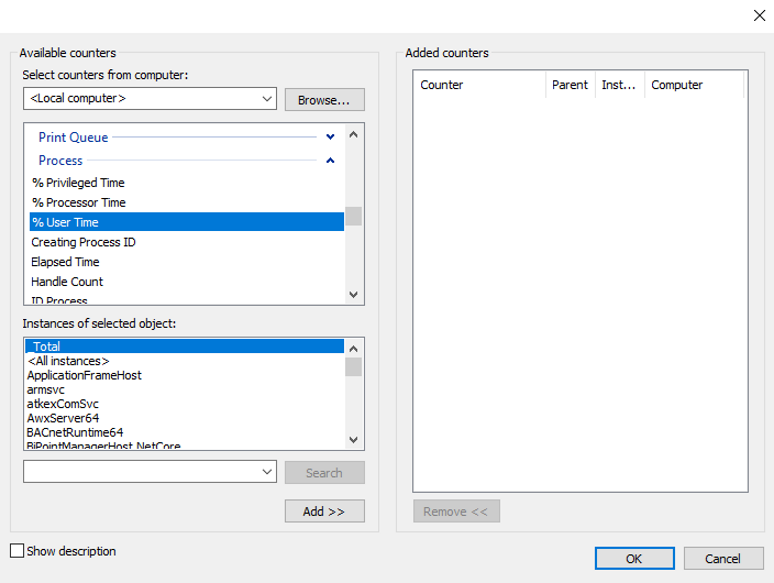
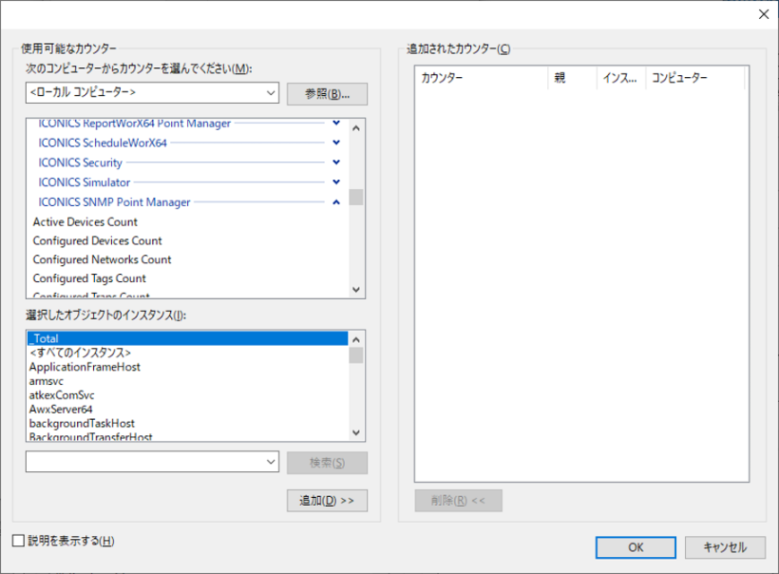
Windows Performance Counters are identified by a category and name. For example here the category is “Process” and the name is “% User Time”.
The only way to read values from Windows performance counters or write values to performance counters is to access them using their category and their name.
Available counters
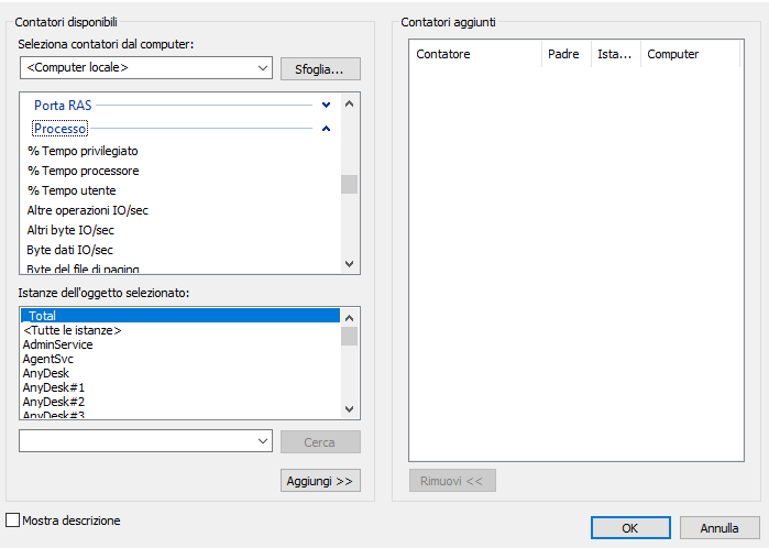
However the category and the name change depending on the language of the operating system. The native language of the OS is meant by this.
For example, here you can see the same counters on a machine where Windows in Italian was installed.
Available counters dialog for the installation of Windows in Italian
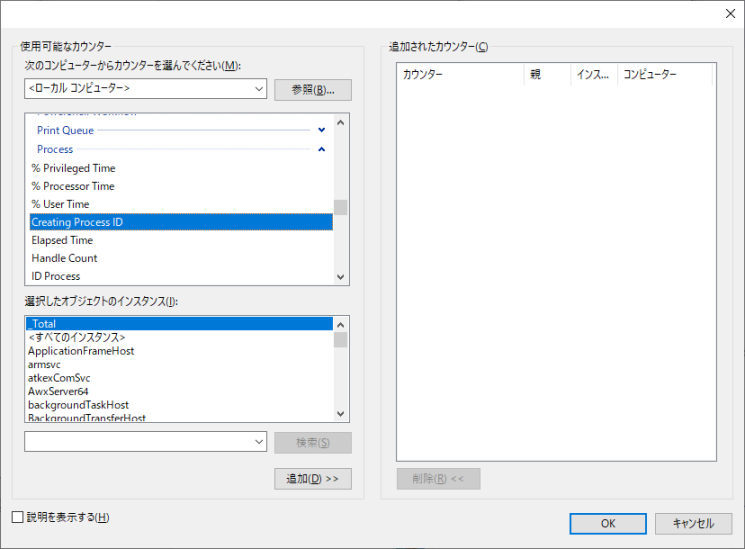
The system counter names don’t change if you switch the language of the OS. They keep the names they had when the OS was installed.
In this case, the system counter names were installed on an English OS and the language was switched to Japanese. The counters did not change.
System counter names in case of switching the language of the OS
As was said at the beginning, FrameWorX Performance Counters rely on the System Performance Counters infrastructure, and follow the same rules of System Performance Counters.
So their name will be in English on an English OS, and in French on a French OS. Their name will not change when you switch the language. They follow the OS language when installed.
So for example, here, GENESIS64 was installed on an English OS, and then the language was switched to Japanese. As you can see, the performance counters are still in English.
Performance counters after the installation of GENESIS64 on an English OS
One side effect of this behavior is pretty evident when you try to browse Performance Counters in the data browser. In this case, the System is in Japanese (the language was switched), but the performance counters are still in English.
This is the correct behavior. The tags in the data browser are used to access the performance counters in Windows. If we localize them, the tags will not work anymore.
Performance counters in the System installed in Japanese
We should also NOT localize the display names, since it can create confusion. This is the pre-defined behavior for many other tags in the data browser (for example the simulated tags): the display name matches the tag name, so the user is aware of what he or she is selecting.
If we start localizing the display names, you may have tags in Japanese (on a Japanese OS) with an English display name, and it will be very confusing. We strongly believe that what you see in the data browser (in this case) should show exactly what is available on the system.
Another side effect regards the Health Monitoring System. The default configuration we install is designed for English Performance Counters. The default configuration will not work on a Windows OS with a different language. However, this is still not a bug. We are providing sample data for the customers, but then they need to adapt it to their configuration. However, this should be documented, and it should be clear to the user that there is this issue if their OS is not a native English OS.
Health Monitor settings
Regarding IoTWorX, the performance counters will be ALWAYS in English because we run in English containers. The Local Provisioning UI or the Visualizer (which should be correctly localized depending on the browser where they are executed) will show them in English in the data browser. The same thing occurs if a user browses all available data from the subscriber.
The recapitulation:
Performance Counter tags should not be localized. If the user sees English performance counters on a Japanese OS, it is correct, because that is how the OS exposes them. It is NOT A localization BUG.
See Also:
Platform Services Health Monitoring Features
ICONICS Modules Performance Counters
System Health Monitor Services Enumeration