|
|
The features on this page require a GENESIS64 Advanced license and are not available with GENESIS64 Basic SCADA . |

![]()
|
|
The features on this page require a GENESIS64 Advanced license and are not available with GENESIS64 Basic SCADA . |
![]()
The System Health Monitor is a tool created to monitor the overall system, provide diagnostic tools and correct the situation. Multiple ICONICS services include performance-related information, via Performance Counter and Data Points (within Platform Services) and the System Health Monitor provides insight into this various information.
System Health Monitor Dashboard
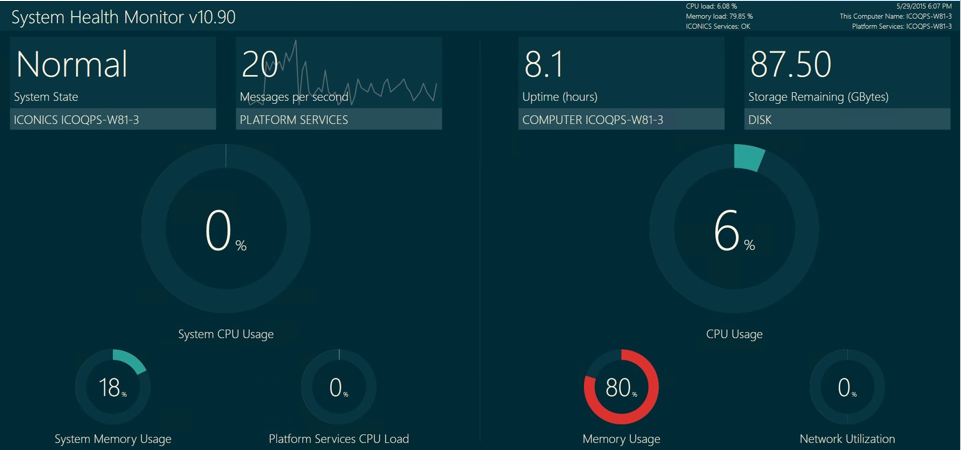
System Health Monitor settings can be accessed through the Health Monitor Settings properties in the FrameWorX node of the Project Explorer in the Workbench. See the Health Monitor Settings topic for more details.
System Health Monitor is a powerful tool that monitors, diagnoses, predicts and corrects. It runs as a standalone service, independent to other modules, without requiring a separate license. It integrates with ICONICS Platform Services, implementing a Point Manager API, with data accessible via the GENESIS64 HMI/SCADA and building management suite.
System Architecture Including the System Health Monitor

System Health Monitor can use inputs from Performance Counters and Data points that are available within:
ICONICS Services
Third-party Applications
Operating Systems
This component can use aggregate functions. It can also generate alarms that can be visualized in AlarmWorX64 Viewer, logged using AlarmWorX64 Logger, and logged to the Windows Event Log. It also has the ability to recycle a Windows Service.
System Health Monitor Architecture
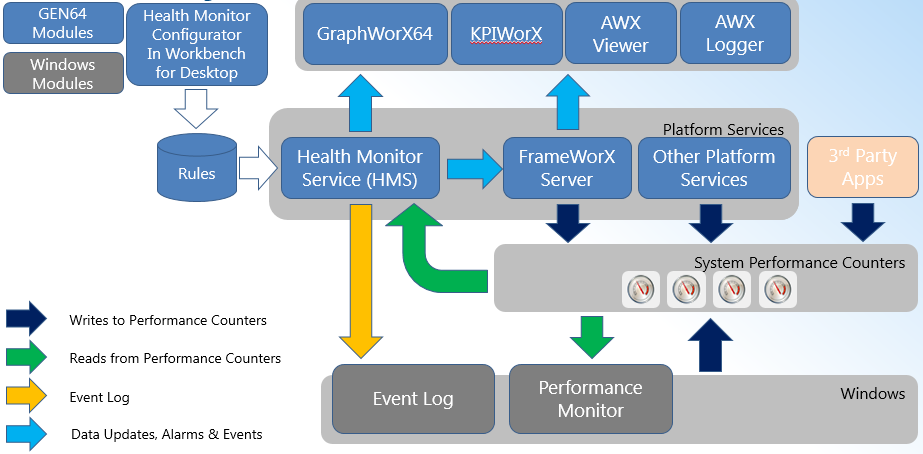
System Health Monitor can monitor defined inputs and then present information via dashboards using modern, intelligent visualization methods. These can be viewed through either GraphWorX64 or KPIWorX and can be launched via the ribbon, via Commanding, or via Hotkey.
System Health Monitor's diagnosis aspects help determine what it means for your system to be "healthy". Each project has different objectives, configurations, requirements, etc. that could be running in different environments. System Health Monitoring configuration involves defining Rules to detect an unhealthy state, along with the possibility to adjust health monitoring parameters.
System Health Monitoring provides 3 health states:
System Health Monitor can generated standard alarms that can be used for escalation and can be visualized by any client, along with indicators in its dashboard.
System Health Monitoring can recycle a Windows Service to rectify associated problems.
System Health Monitor has built-in tools for an out-of-box experience. Its Performance Counters integrate with Windows Performance Monitor and third-party tools. The alarms logged to the Windows Event Log can be viewed by the Windows Event Log Viewer itself or by third-party tools. It comes with predefined dashboards, inputs and rules, as well as default settings for most applications. It can be configured through the Workbench and also supports custom configuration.
The System Health Monitor high-performance dashboard is easy to use, with three levels:
AlarmWorX64 Logger
AlarmWorX64 Server
AlertWorX Point Manager
AlertWorX Email Server
AlertWorX Pager Server
AssetWorX Point Manager
AssetWorX Runtime
BACnet Point Manager
BACnet Runtime
BridgeWorX Runtime
Energy AnalytiX Point Manager
Energy AnalytiX Runtime
Facility AnalytiX Point Manager
Facility AnalytiX Runtime
FrameWorX
Global Aliasing Point Manager
GridWorX Point Manager
Hyper Historian Collector
Hyper Historian Logger
ICONICS Modbus OPC Server
Language Aliasing Point Manager
MergeWorX
MobileHMI Point Manager
OData Connector Point Manager
Recipe Point Manager
ReportWorX Runtime
ScheduleWorX64 Point Manager
ScheduleWorX64 Runtime
Security Point Manager
SNMP Point Manager
TrendWorX64 HDA Server
TrendWorX64 Logger
UDM64 Runtime
Web Services Point Manager
See Also:
Platform Services Health Monitoring Features
ICONICS Modules Performance Counters
System Health Monitor Services Enumeration