![]()
![]()
The Hyper Alarm Server exposes two basic areas of information – performance counters and trace messages. Performance counters can be monitored in standard Microsoft Windows tools, and mainly gives the information about a server performance (process dynamics) – e.g. how many input/output events is processed. While TraceWorX messages allows to monitor processing logic and eventual error states.
Hyper Alarm Server performance counters can be found in the section named “ICONICS Hyper Alarm Server” (Performance Monitor tool - Windows). The next section describes performance counters and their purpose for each alarm server area.
|
Area |
Name |
Description |
|
Client Interface |
Areas module - processing load % |
The CPU load of the areas processing module. This module takes care of alarm rollup to parent Areas, computing alarm counters and filtering of alarms for individual client subscriptions. |
|
Areas module - event input queue length |
The number of events waiting in the input queue to the areas processing module. This should remain at zero, or could raise for a short period of time in the case of an alarm peak. |
|
|
Areas module - events processed/sec |
Events per second processed by the areas processing module. |
|
|
Alarm Source Processing |
Sources count |
The number of configured alarm sources. |
|
Source types count |
The number of configured alarm source types. |
|
|
Queued source tasks |
Every operation done in alarm source is represented by a task. These tasks are queued in the processing queue. If this number is high for longer period, then it may signal system overload. |
|
|
Source tasks/sec |
The number of alarm source processing tasks per second. This number shows system utilization. |
|
|
Task processing threads |
Number of threads processing queued tasks. Maximum number of threads is a part of configuration database. |
|
|
Data Point Access |
Data point changes/sec |
The number of data changes received from FrameWorX infrastructure; this can be limited by increasing data points scan rate. |
|
Data points on scan |
The number of data points currently on scan. |
|
|
Async data access calls/sec |
This number represent all asynchronous (historical) data calls per second – see “Alarm Type Expressions” for details. |
|
|
Timer |
Time events/sec |
The number of the global runtime timer events processed per second. |
|
Scheduled time events |
The number of pending (scheduled) time events in the global timer queue. Doesn’t have direct influence on overall alarm server performance. |
|
|
Alarm Evaluation Triggers |
Trigger events/sec |
Rate of all source processing trigger events processed per second. |
|
Triggers count |
The number of configured alarm source triggers. |
The Hyper Alarm Server can trace many different types of messages that are manageable in a standard way by using TraceWorX components. However, the alarm server may expose traces that requires some additional filtering, because exposing all traces at the same time may cause system overload.
The following sections will focus on trace filters configuration. In the alarm server, these traces mainly allow to monitor internal data flow – i.e. data inputs, data processing and data outputs.
The “Point Tracing” configuration supports on-line changes thus can be modified on running systems. The following picture shows point tracing configuration panel available on the “System Settings” configuration form.
Point Tracing
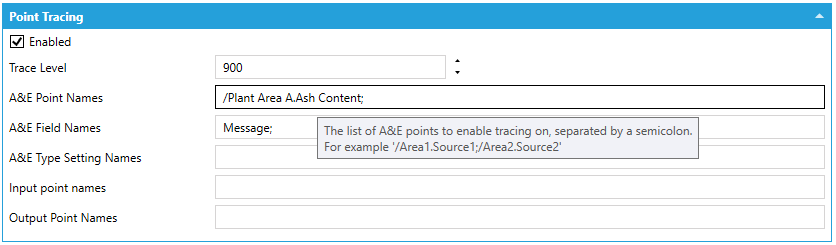
Enable – Enable/disable point tracing for all point traces.
Trace Level – Trace level of generated trace messages, setting higher levels allow to filter out other generic messages out of the trace log.
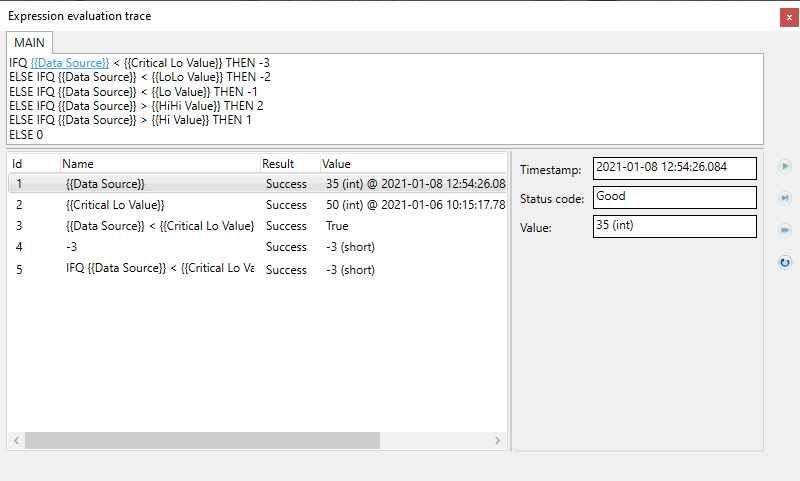
Alarm types uses expressions on many different places - condition evaluation, field values and settings. Since expressions are used on many important places and can be relatively complex, it important to have some way to see expression evaluation stacks. Alarm Type expressions can’t be evaluated by themselves because they rely on input values. These values are set when an Alarm Type is instantiated by an Alarm Source.
A&E Point Names – Enables condition evaluation tracing. One or more Alarm Sources can be configured here. Each name is separated by semicolon. Unfortunately, this version doesn’t support point name browser thus it has to be filled-in manually. Point name is the same as the point name available through the GENESIS64 data point browser, prefix “alms:” is optional.
A&E Field Names – Enables field evaluation tracing. Allows to specify multiple field names (as configured in an Alarm Type) separated by semicolon. For the list of available names see the table below.
|
Field Type |
Name |
|
Message |
@Message |
|
Severity |
@Severity |
|
Requires Ack |
@RequiresAck |
|
Custom |
A custom name specified in the Alarm Type – Fields page |
A&E Type Settings Names – Enables settings evaluation tracing, multiple names are allowed. Names must be separated by semicolon. The following names are supported, These correspond to the individual settings described in System Settings.
|
Name |
|
EnableUserOutOfService |
|
OutOfService |
|
EnableUserSuppressedByDesign |
|
SuppressedByDesign |
|
EnableUserShelved |
|
Shelved |
|
AlarmOnDelay |
|
AlarmOffDelay |
The following picture shows a part of the TraceWorX log, showing condition evaluation traces. The red box marks a reference to the expression evaluation stack browser.
TraceWorX Log with Condition Evaluation Traces
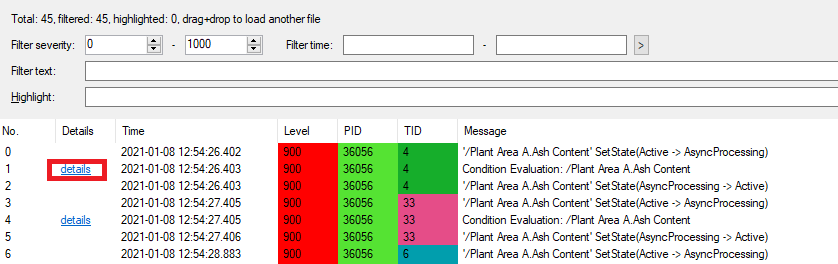
When clicking on “details” reference the following expression browser appears.
Expression Evaluation Trace
These settings allow to enable traces for specific input and output data points. Each data point traces then all messages related to point subscriptions – subscribe, release, point properties and data updates.
Input Point Names – Enables input data point updates – i.e. updates that are coming from the FrameWorX infrastructure. Data point names are the same as in the FrameWorX server and must be separated by semicolon.
Output Point Names – Enables output point tracing. Point names are the same as in the GENESIS64 data point browser including point manager prefix. Names must be separated by semicolon. This feature enables tracing of all the traffic between the Hyper Alarm Server and its clients. That includes requests, responses, data updates, event updates, etc.
See Also: