![]()
![]()
To Create a Calculated Condition/Events:
Start the Workbench, then expand your project. Next, expand the Historical Data node to show the Hyper Historian node. Expand the Hyper Historian node to show the Data Collections node.
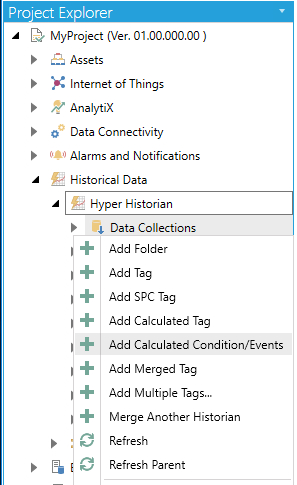
Right-click the Data Collection node in the navigation tree, or any of its sub-nodes, and select Add Calculated Condition/Events, as shown in the figure below.
Add Calculated Condition/Events from the Project Explorer
-OR-
Select the Data Collections node in the Project Explorer, or any of its sub-nodes, then click on the Add Calculated Condition/Events button, shown below, in the Edit section of the Home ribbon in the Workbench.
Add Calculated Tag Button
This opens the Hyper Historian Calculated Condition/Events properties window, shown below, beneath the Project Details section in the Workbench. Enter a name in the Calculated Condition/Events Name text entry field. The name should be short. It is used as a part of the browse name, and for that reason, you want to keep it short. The Display Name field, not the Name field, is where you want to provide lengthy detail so that the Name field is not long. Tags are logged with the browse name that you provided in the Name field, so you want to keep the name short.
Hyper Historian Calculated Condition/Events Properties
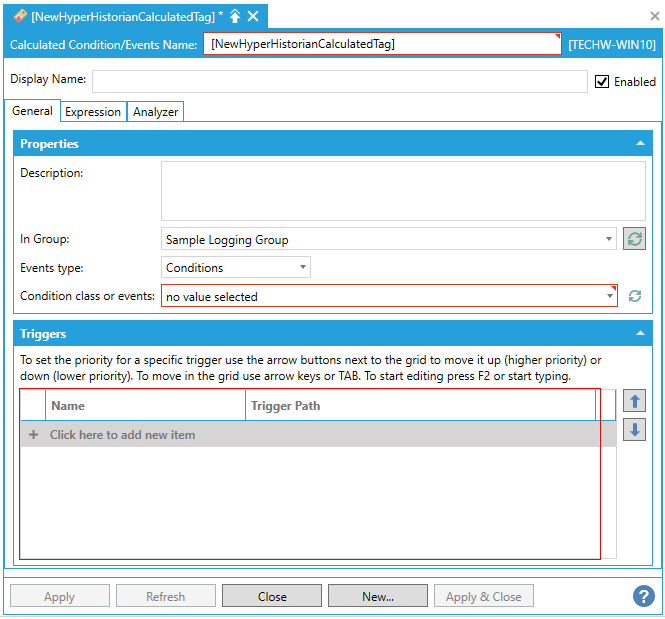
Optionally, you can enter a Display Name which appears for the calculated tag in the Project Explorer. Use the display name to supplement the shortened tag name that you entered in the Name field. If a Display Name is not provided, the Name appears in the Project Explorer instead.
Leave the Enabled checkbox unselected until you are ready to begin using the calculated tag.
General Tab of the Calculated Condition/Events Properties
Description - Enter a description for the Calculated Condition/Events in the text entry field.
In Group - Use the pulldown menu to select a group (configured via the Loggers & Groups).
Events type - Use the pulldown menu to select from Simple events or Conditions. "Simple events" will generate a simple event in each calculation period, where the result of the expression is not zero and not nologval(). "Conditions" will generate a condition change event whenever the result is different from the last result and is not nologval().
Condition class or events - Use the pulldown menu to select an item previously created under the Condition Classes root item. This will map the numerical result from the expression to actual events.
In this section, to set the priority for a specific trigger, use the arrow buttons next to the grid to move it up (higher priority) or down (lower priority). To move in the grid, use the arrow keys or TAB. To start editing, press F2 or start typing.
Click on the "+Click here to add new item" link to add a new trigger item. You can then specify which triggers in the configuration will activate the tag calculation. Use the arrow button next to the table to sort the triggers by priority.
Expression Tab in the Calculation Condition/Events Properties
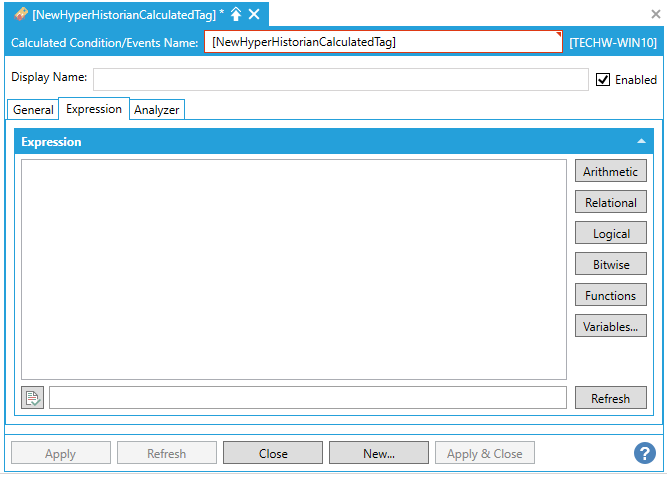
The Expression tab in the Calculation Condition/Events Properties includes the full functionality of the Expression Editor tool that is used throughout multiple ICONICS components and tools.
See Expression Editor, Rules/Expression Editor, Expressions in the Data Browser, Global Expressions for more information on using the Expression Editor.
In this tab it is possible to test created expression to understand calculation procedure in Hyper Historian. Since this analysis is done inside Hyper Historian runtime, all calculation changes have to be applied (stored in the configuration DB) and Hyper Historian service must be up and running.
Analyzer Tab in the Calculation Condition/Events Properties
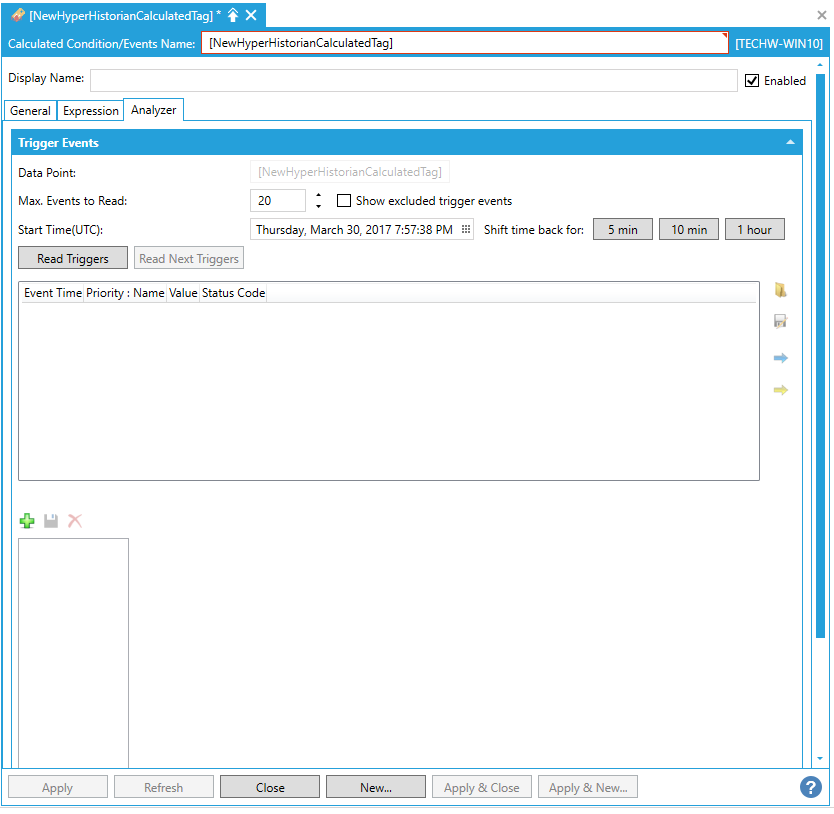
Data Point - The data point should be automatically set by the current saved Calculation Condition/Events.
Max. Events to Read - Enter a number of maximum events in the text entry field (or use the up/down arrows).
Show excluded trigger events - Click this checkbox to ensure that excluded trigger events are shown in the results in the box below.
Start Time(UTC) - Enter a starting day/date/time in the text entry field or click on the  button to open the Date/Time Picker and select them.
Shift time back for - Click on either the 5 min, 10 min., or 1 hour buttons to quickly shift the selected time back by that increment.
Read Triggers - Once you have set the above criteria, click this button to collect and list the associated triggers.
Read Next Triggers - Following the initial load of triggers, click this button to collect and list the next set of triggers.
The Trigger Events will appear where you can see their associated Event Time, Priority:Name, Value and Status Code.
 - Loads an existing trigger event list. Clicking this button allows you to open a file browser and navigate to your selected trigger event list.
 - Saves the current trigger event list. A file browser allows you to set the file save location.
 - Starts calculation analysis for currently selected item, once started then related entry appears in the list below and allows to start stack evaluation procedure.
 - Starts calculation analysis for currently selected trigger if the trigger is an expression-based trigger, works in the same way as evaluation of calculation analysis described previously.
This section allows to display complete evaluation stack. Once the data for analysis is selected on left-hand side then click on “play” button on the right-hand side (green arrow) and then evaluation stack appears underneath expression part. Evaluation stack can be traced by using buttons on right-hand side similarly to standard debugging – move to the next step, skip function call, restart debugging. If custom function is used, then it appears on the next page to the Main expression text. Each custom function based on expression can be traced in this analyzer too. Blue part of the expression text identifies the part of an expression selected in evaluation stack below.
Every evaluation stack can be saved as a file and used later for another re-evaluation.
 - Loads an existing trace from file. Clicking this button allows you to open a file browser and navigate to your selected analysis (trace) file.
 - Saves the current trace file. A file browser allows you to set the file save location.
 - Removes selected trace from the list – it doesn’t delete trace file.
This tab is there to simplify re-calculation of currently configured calculated tag - don’t forget to apply all the modifications before entering new recalculation task. Otherwise, it may use old configuration properties for value calculations. The same re-calculation action can be done in “Calculation Tasks Management” form located underneath of “System Administration” folder, but it requires to open up another form and fill-in a tag filter to prevent re-calculation of other calculated tags.
See Also:
Using the Data Collections and Groups Nodes