Configuring TraceWorX
The Workbench contains a diagnostics tool called TraceWorX. It is designed for system integrators, OEMs and customers who want tools for their own troubleshooting and diagnostics.
TraceWorX tracks the runtime activity for each integrated application and logs the Runtime data to a log file based on user-configured trace levels. The log file provides a thorough report detailing all activity for the application, including the time, date, severity level, and description of the event or problem.
This document will describe how to turn on TraceWorX to log information about the application in question.
To Configure TraceWorX:
- Launch TraceWorX by opening the Workbench, then click on the Tools ribbon, then click on the TraceWorX button (shown below) in the Tools section of the Tools ribbon.
TraceWorX Button

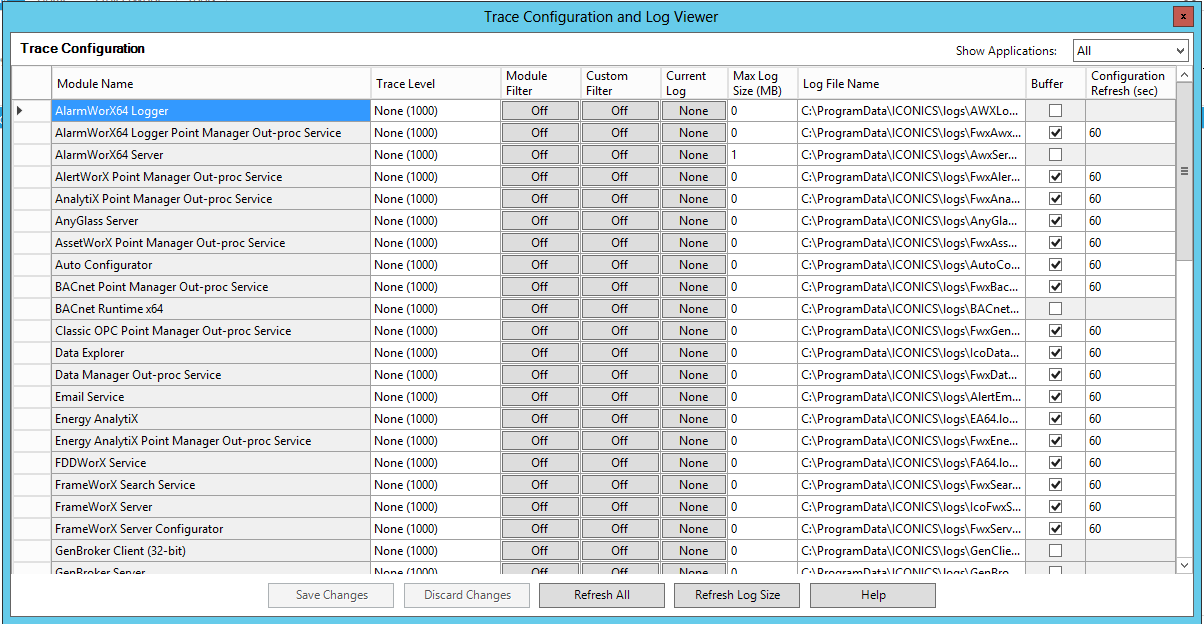
- The Trace Configuration and Log Viewer window, shown below, will appear beneath the Project Details section of the Workbench. By default, tracing is disabled for all the applications. The Show Applications pulldown in the top right of the window allows you to show All, V8/V9 Only or V10+ Only applications in the tracing configuration.
Trace Configuration and Log Viewer Window
Trace Settings
- Set the Trace Level from the drop down menu. Options include None (1000), SevereError (900), Error (800), Warning (700), Normal (600), Debug (400), Debug Verbose (100) and All (0). You can set the tracing level to “All”, which will log everything. However, this may slow down your system a bit. You may turn the tracing level to something “low” such as “Error”. This will have less of an impact on your system.
- You can choose to use a Module Filter by clicking on the checkbox. This opens the Configure Module Filter window shown below. Click the checkbox for Use Modeule Filter to allow for editing within the window.
Configure Module Filter Window
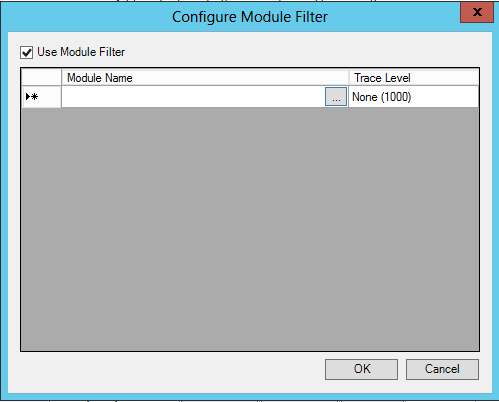
Click within the Module Name column to add a new module. Click on the ellipsis button [...] to open a file browser to select a module.
After you have selected your Module Name, you can set its specific Trace Level in the next column. Options are the same as the main level Trace Level settings [None (1000), SevereError (900), Error (800), Warning (700), Normal (600), Debug (400), Debug Verbose (100) and All (0)].
Click OK to close this window.
- You can choose to use a Custom Filter by clicking on the box. This opens the Configure Custom Filter window shown below.
Configure Custom Filter Window
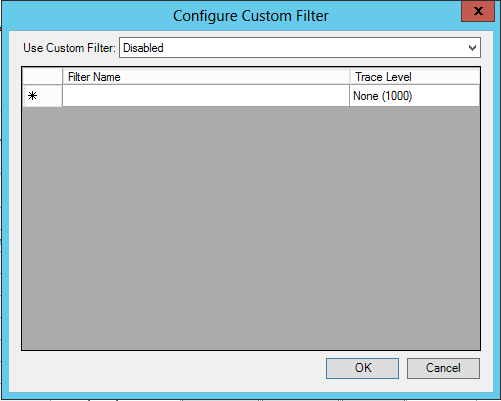
Use the top pulldown menu to set how the messages will be logged. Options include:
-
Disabled
-
Log custom messages if module is logged
-
Log custom messages only
-
Log custom messages and module messages
-
Log all custom messages if module is logged
You can click within the Filter Name column to enter filter criteria or click on the ellipsis [...] button to open the Data Browser to select your filter. After you have selected your Filter Name, you can set its specific Trace Level in the next column. Options are the same as the main level Trace Level settings [None (1000), SevereError (900), Error (800), Warning (700), Normal (600), Debug (400), Debug Verbose (100) and All (0)].
Click OK to close this window.
- Click on the Current Log button to perform actions such as View Log, Delete Log or ZIP Log.
- You can change the Max Log Size (via the text entry field) if you wish. A size of 0 KB means the file will grow indefinitely.
- Enter a Log File Name in the text entry field or click on the ellipsis button to open the Save As dialog box to name the log file and set a destination for the file.
- For 'Buffer', when checked (set to 'True'), the file writes are buffered (the file remains open and flush is not called). When unchecked (set to 'False'), the file is flushed and closed after each trace entry is written. Buffering can possibly improve the performance of trace logging (depending on the frequency/quantity of what is being logged), but if an application crashes, you could miss any trace messages that have not been flushed yet.
- For Configuration Refresh, this sets the frequency at which TraceWorX checks for configuration changes. For example, if GraphWorX64 is already running and you change the trace level for GraphWorX64, if the configuration refresh is 60, it could take up to one minute (or less) for the change to take effect. Faster refresh rates will make applications respond more quickly to TraceWorX configuration changes, but can slow the system down more overall due to the extra overhead of having to the check the configuration for changes more often. One suggestion is to return this setting back to 60 when tracing is complete. It is important to remember that this is the rate at which it checks for ANY TraceWorX configuration change, even enabling/disable tracing. So even when all TraceWorX modules are set to Level=None, the modules set at a refresh rate of 10 would be re-reading their configurations every 10 seconds to see if tracing has been turned on. The default value of 60 was chosen to have negligible impact on a running system when TraceWorX is not being used.
- The Save Changes button allows you apply the configuration changes. You also have options to Refresh All or Refresh Log Size.
See also:
TraceWorX
Tools
Ribbon