The Health Monitor Settings node in the FrameWorX provider tree explorer in the Workbench allows users to configure the inputs and rules for System Health Monitoring.
To Configure Health Monitor Settings:
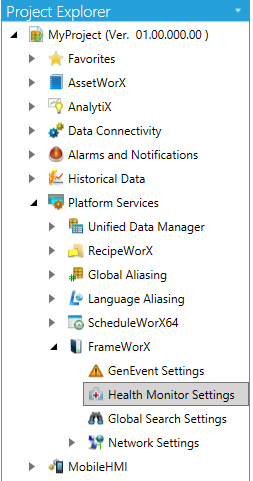
In the Workbench, expand the Platform Services node and then the FrameWorX node.
Selecting the Health Monitor Settings Node in the FrameWorX Provider in Workbench
Double-click the Health Monitor Settings node.
-OR-
Select Health Monitor Settings, then click on the Edit button, shown below, in the Edit section of the Home ribbon in the Workbench.
Edit Button

This opens the Health Monitor Settings properties window in the right side of the Workbench, as shown below.
Health Monitor Settings - Data Inputs Tab
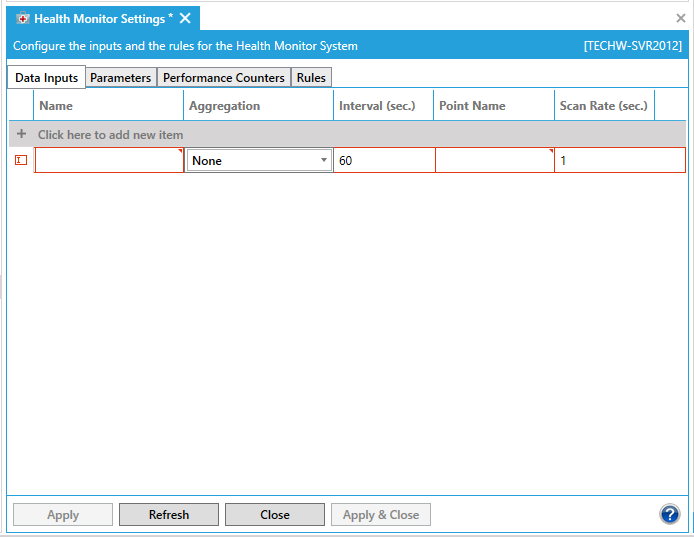
The Health Monitor Settings properties contains four tabs: Data Inputs, Parameters, Performance Counters, and Rules.
In the Data Inputs tab, click on "Click here to add new item". Enter a name for the Data Input in the Name text entry field. Click in the Aggregation field and you will be able to use the pulldown menu to select from either None, Minimum, Maximum or Time Average. Next, enter an Interval in the following text entry field. When you click within the Point Name field, you can enter a point name directly in the text entry field or click on the  button to open the Data Browser and navigate to your selected point name. You can then enter a Scan Rate in the last text entry field.
In the Parameters tab, you can enter a parameter Name and Value.
Health Monitor Settings - Parameters Tab

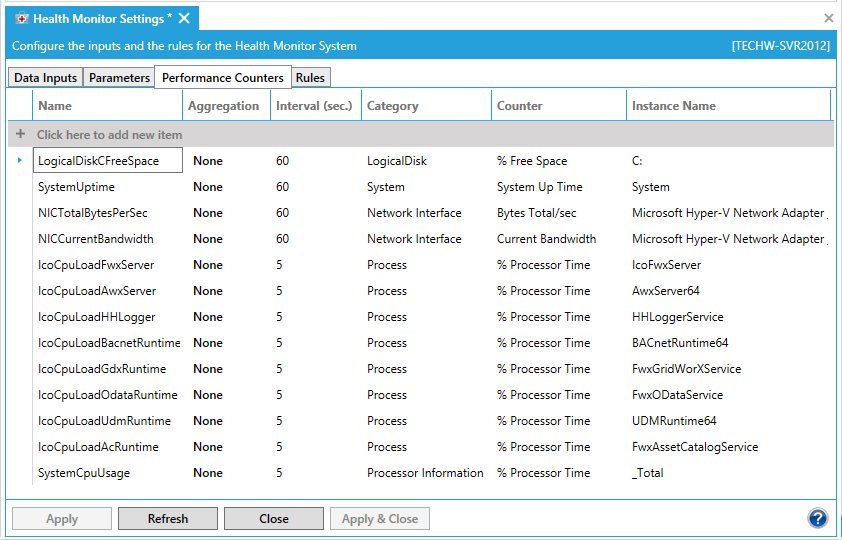
In the Performance Counters tab, click on "Click here to add new item". Enter a name for the Performance Counter in the Name text entry field. Click in the Aggregation field and you will be able to use the pulldown menu to select from either None, Minimum, Maximum or Time Average. Next, enter an Interval in the following text entry field. Click in the Category field and you will be able to use the pulldown menu to select from the list of categories. Depending on what you selected in the Category field, the Counter field will provide an additional pulldown menu for you to select from the list of counters. The last field is Instance Name, where you can enter this info into the text entry field or, depending on the Category/Counter, use the pulldown menu to select from the list of instance names.
Health Monitor Settings - Performance Counters Tab
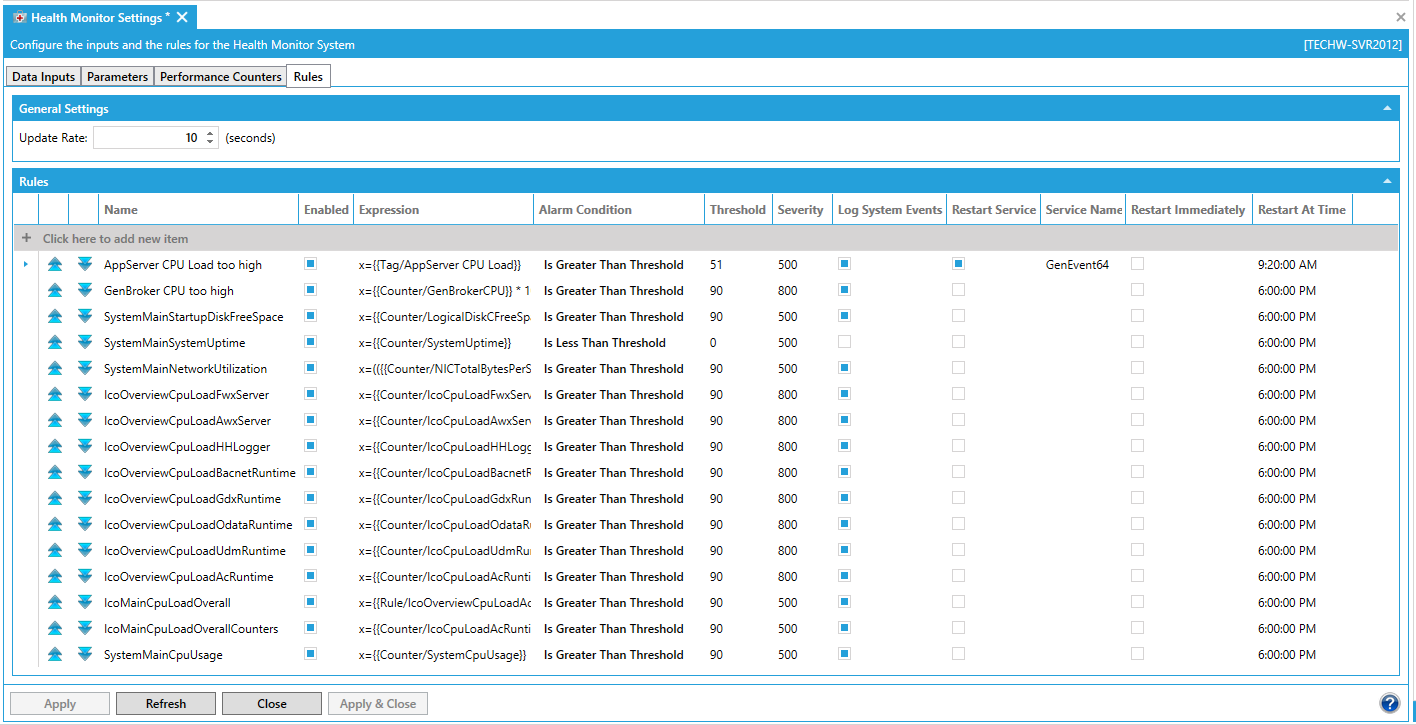
In the Rules tab, in the General Settings section, you can enter an Update Rate (in seconds) in the text entry field. In the Rules section, click on "Click here to add new item" to enter a new rule. Enter a name for the Rule in the Name text entry field. The Enabled field allows you to set, via checkbox, whether the rule is currently enabled (this is set as enabled by default). In the Expression field, you can enter an expression directly into the text entry field or click on the  button to open the Configure the expression window. [Once you have set your expression, click OK to return to the Health Monitor Settings.] In the Alarm Condition field, you can use the pulldown menu to select from: Is False, Is True, Is Greater Than Threshold, Is Greater or Equal Than Threshold, Is Less Than Threshold, or Is Less of Equal Than Threshold. You can then set a Threshold in the following text entry field. Next, you can set the Severity in the next text entry field. The Log System Events field allows you to set, via checkbox, whether to log the system events associated with the rule (this is set as enabled by default). The Restart Service field allows you to set, via checkbox, whether to restart a specific service (this is set as disabled by default). If the Restart Service checkbox is checked, this activates the Service Name field, where you can select the service to be restarted from the pulldown menu. Also, depending on if the Restart Service checkbox is checked and a service has been selected from the Service Name field, you can decide whether to Restart Immediately (via checkmark) or enter a Restart Time in the text entry field or click on the
  button to open the time picker window. The
  buttons allow you to move the rule within the list of rules.
Health Monitor Settings - Rules Tab
Once you have made your changes to the Health Monitor Settings properties, click Apply to save your settings, then Close to close the window.
See Also:
Platform Services Health Monitoring Features
ICONICS Modules Performance Counters
System Health Monitor Services Enumeration