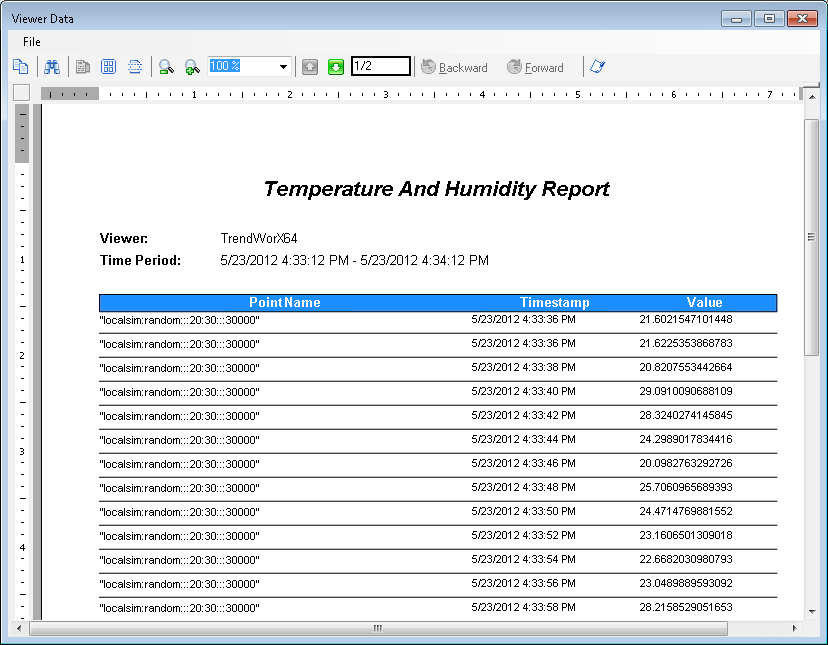
When you export trend data or run statistics for the pens in a chart, the resulting report appears in the TrendWorX64 report viewer that looks like the sample shown below. Using the report viewer, you can print or save the report or its content to a file. You can export the report to one of the following file formats: HTML, DHTML, PDF, Excel, Tiff, RTF, or CSV. The format you choose determines how the data is formatted. For example, if you save the data to an Excel or CSV format, it is stored in columns; but when saved to an HTML or PDF format, the data is formatted as you see the report in the report viewer.
Sample Appearance of the Viewer for Trend Reports

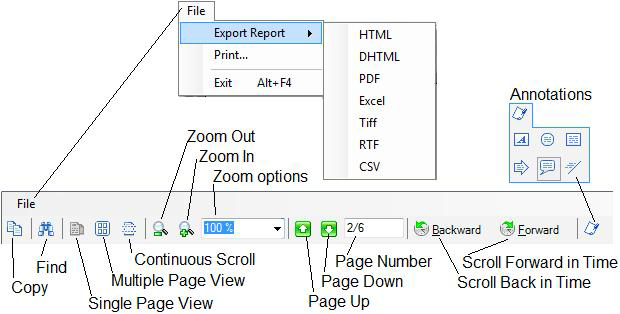
To work with the report, use the buttons on the toolbar at the top of the dialog box:
Toolbar Options

You can do the following:
Export the report data to a file of one of the following formats: HTML, DHTML, PDF, Excel, Tiff, RTF, or CSV.
Print the report as it appears in the dialog box.
Copy the content of the report so you can paste it in another file or format.
Find a specific piece of data on the report, using a standard Windows Find dialog box.
View data on a single page or choose a format for viewing multiple pages at one. Continuous scroll stacks pages of the report end to end you can scroll through the entire report.
Zoom in or out, or specify a percentage by which you want to zoom.
Page up or down one page at a time, or enter a page number if the report is long.
Scroll backward and forward through points in time within the report.
Flag annotations in the report using an icon that you select. Possible annotations include: Text Annotation, Circle Annotation, Rectangle Annotation, Arrow Annotation, Balloon Annotation, and Line Annotation.
See also: