CPU Usage and Overall Performance Optimization
TrendWorX64 Viewer has an ability to replay large amounts of historical data in many pens. However, when replaying large periods from the history, the Viewer could be overloaded by too many requested samples. In such cases its parameters must be correctly set to replay data smoothly and without any lag. This topic focuses on Hyper Historian as the source of OPC historical data, covering historical data replay optimization for cases such as the following:
- TrendWorX64 Viewer consumes considerable amount of CPU performance.
- Replaying Raw data from an OPC historian.
- Replaying Raw OPC historical data for multiple pens.
- Replaying large amounts of collected samples per a single historical tag.
Graphic Optimization
There are a couple of configurations you can use to optimize the TrendWorX64 Viewer graphical display.
- Viewer size - You can improve the performance such as Viewer response period time by decreasing the Viewer size.
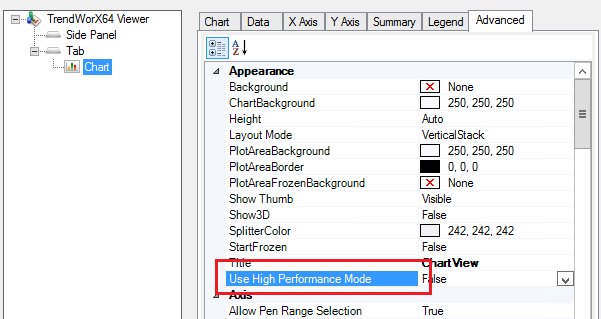
- Use High Performance Mode - There is a special option in the Chart -> Advanced menu called “Use High Performance Mode”. Enabling this feature will disable the Anti aliasing filter during data displaying which significantly influences the CPU usage in TrendWorX64 Viewer runtime mode, chart initialization time when using multiple pens, or when the chart is running in “full screen” mode.
Figure 1 - Advanced Trend Viewer Properties
Time Optimization
Figure 2 - Time & Rate Properties
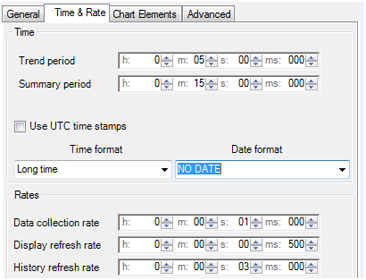
- Trend Period – Shortening the Trend Period (displayed history interval) will affect the overall performance of TrendWorX64 Viewer, which means CPU usage, memory usage chart data initialization time and chart refresh time (under high CPU load) as well as chart manipulation response time.
- Data collection rate – This rate is used only when displaying “realtime” history from the logger. Longer rate positively affects (less requests per time unit) the communication load between server and client.
- Display refresh rate – Configuring this type of rate to a longer period will affect the CPU usage when the Viewer is in the Runtime state and displaying data.
- History refresh rate – Under some conditions this rate is configured by the Viewer itself to protect overloading of client/server communication. Otherwise this time defines how often the TrendWorX64 Viewer will retrieve the historical data.
Numbers Optimization
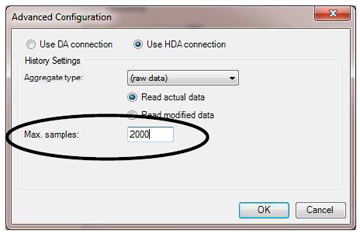
- Max. samples – This “Single Pen Buffer” defines the maximum samples that will be displayed in this particular pen. It can be defined only when the “(raw data)” Aggregate type on the pen is selected. When too small of a number is defined not all data will be displayed and the Pen Status field in the legend will show a message similar to “Not all data is visible, because the buffer is too small.” Therefore this number should always be oversized when operating with raw data.
Figure 3 - Limiting Maximum Samples
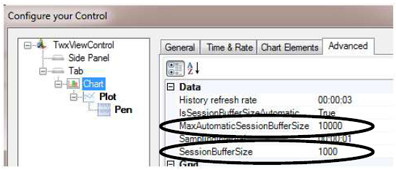
- SessionBufferSize – This number defines the buffer size used for a pen when caching data. Setting this limitation will highly affect the CPU usage when displaying and replaying data. However, this buffer size is accepted only when “IsSessionBufferSizeAutomatic” is set to False. Otherwise, the following automatic buffer will be accepted.
- MaxAutomaticSessionBufferSize – When some kind of aggregation is used this buffer is a maximum sample count that the aggregate can use for drawing the particular pen after all values are calculated according to the currently applied aggregate type. Configuring this number will strongly affect the overall CPU usage.
Figure 4 - Setting Buffer Sizes
Aggregates
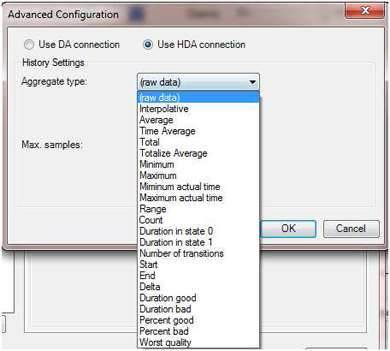
There are many types of aggregation you can select and each of them has a different influence on data replaying performance. For example these are the most common used aggregates: Interpolative, Minimum, Maximum, Average, Start and End.
Aggregates should be used when there is a need to replay larger amounts of data with relatively short collection periods and many samples or more pens. You can limit the Aggregates buffer size to tune up the performance and make the performance replaying process less CPU and memory consuming.
Interpolative, Minimum, and Maximum aggregates are the fastest aggregates, so they should be used for very large replaying periods.
Figure 5 - Available Aggregates
For more details about ICONICS Hyper Historian aggregates, refer to the Aggregate Groups in Hyper Historian topic.


