
Smart Symbols are an enhanced version of object groups. They greatly simplify the configuration and save engineering time by allowing a configuration of properties of inner objects without a need to drill-into the symbol.
Create a Circle
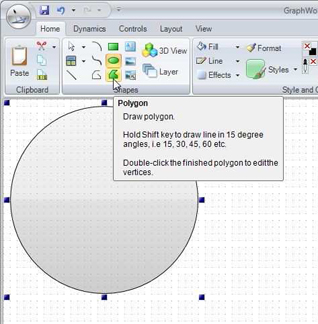
Create a polygon
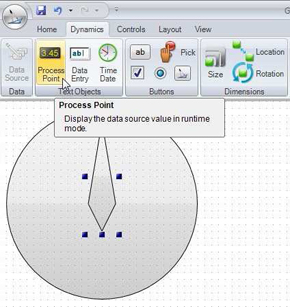
Insert a Process Point
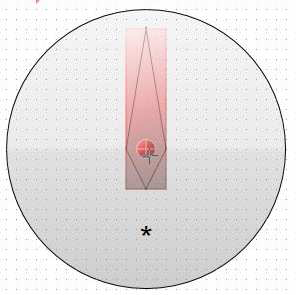
Select the former created polygon (or vertical line) and choose “Rotation” from the “Dynamics” ribbon.
Change the Pivot point by dragging the red dot to the center of the circle you created at the beginning.
Change the Pivot Point
Define the start angle and end angle, either by entering the values in the dynamics pane or by dragging the shadow object of the needle to the start and end location.
Set Start and End Angle

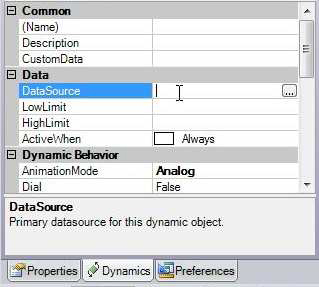
Select the same OPC tag you chose for the Process Point as Data Source from the dynamics pane. This is important, as we want the same value reflected in the rotation as well as displayed in the process point.
Select Data Source
Select all objects (Circle, Polygon and Process Point) and group them using the group function on the Home tab of the ribbon.
Group Selected Objects

The group has become one object now. While the group object is selected, go to the “Dynamics” tab of the ribbon and select “Convert Symbol”.
Converting a Symbol

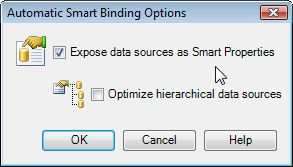
The smart symbol wizard pops up. Check the “Expose data sources as Smart Properties” option to make the Data Source a smart property. You can leave the second option unchecked.
Smart Symbol Wizard
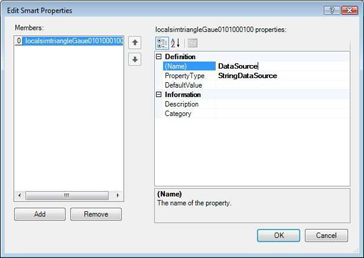
Click OK to get to the next dialog. Here define the name of the exposed data source. In our case we want to rename “localsimtriangleGauge0101000100” to something more readable like “DataSource”.
Smart Properties
You have created a simple smart object. You can duplicate this object and change the data source by selecting a different OPC tag using the “DataSource” smart property, highlighted below.
Smart Properties DataSource

If you have your symbol library open, you can drag and drop your smart symbol to the library so that it is available to all your projects.
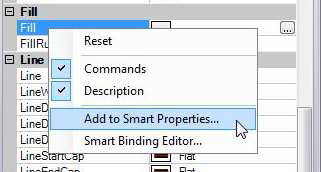
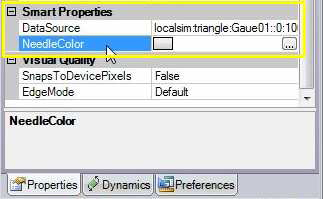
You can add smart properties to any smart symbol. In this section, we will detail how to expose the color property of the gauge needle created in the previous section.
Expose Properties as Smart Properties
Define Property Name
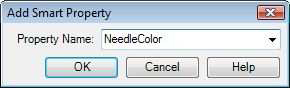
Added NeedleColor Property
See also: