The Data Mining OPC sServer in GENESIS32 is an easy way to access data within a database as OPC data. Although GENESIS64 does not have an OPC UA counterpart, you can use the OPC DA server available in GENESIS32 to access data in a database.
NOTE: If you have licensed your GENESIS64 system, you will need the option bit to run the Data Mining OPC server. Otherwise, everything will run in two-hour demo mode.
This is a quick introduction on how to read Data Mining OPC tags in the Data Mining OPC server in GENESIS32 with GraphWorX64. This example uses the default Data Mining Configuration that comes with the GENESIS32 installation. If you need to learn more about how to configure the Data Mining OPC server, refer to the application note called "Data Mining – Quick Start in GENESIS32".
Before you begin, GENESIS64 and the Data Mining OPC server must be installed on the same machine. For instructions for installing both GENESIS32 and GENESIS64 on the same machine, refer to the application note called "ICONICS - Running All ICONICS Products in the Same Machine".
First, you will need to be able to read a Data Mining Tag that returns a single value:
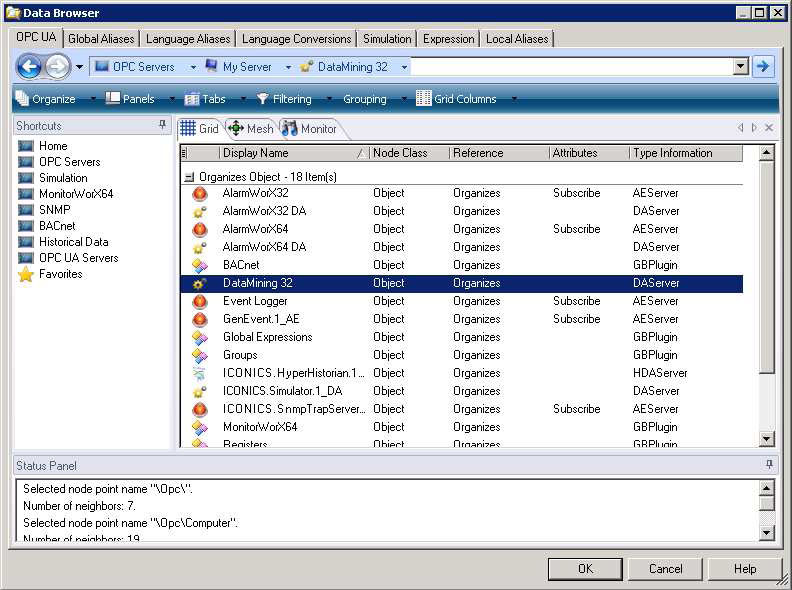
Data Mining OPC Server in the Data Browser
In some cases, the Data Mining tag can return an array (e.g., reading an entire table). You can represent this table by iterating through the return array and showing it in a table format. This section of the example details how to show the return data in a database grid.
First, you will need to add a DataGridView control into your display. You can do that by going to the Toolbox explorer, choose Windows Forms, and drag the DataGridView control onto the display
NOTE: If you don’t see this control in your list, you will need to add it. The control is within the System.Windows.Forms.dll located in \Windows\Microsoft.NET\Framework64\v2.0.50727
Once you added the DataGridView control, add a button on the display to run a script. We will use the script to fill the DataGridView with data.
Before we add any script, we will need a process point to read the value. You can simply add the process point to the display without specifying a data source. However, since we will be working with it in our script, you should name the process point. In this example, we named the process point “CustomerTable”.
NOTE: You should also name the DataGridView control. However, the control comes with a default name when you add it onto the display. In this example, we will use that name “DataGridView1”.
If you are not familiar with scripting in GraphWorX64, and you find yourself lost in the next section, read the Scripting topics.
Enter the code below in the script editor.
var ppt : GwxDynamic =
ThisConfiguration.GetDynamicObjectByName("CustomerTable");
var wfctl : Ico.Gwx.GwxWindowsFormsControl =
Ico.Gwx.GwxWindowsFormsControl(ThisConfiguration.GetObjectB
yName("DataGridView1"));
var grid : System.Windows.Forms.DataGridView =
System.Windows.Forms.DataGridView(wfctl.Control);
var dataTable : DataTable = new DataTable();
var myRow : DataRow;
dataTable = SetupColumns(dataTable);
for (var i=0; i<=10; i++)
{
myRow = dataTable.NewRow();
for (var j=0; j<=5; j++)
{
ppt.DataSource =
"@tag:ICONICS.DatabaseOPCServer.3\\AccessConnectio
n.DataSource04.Tag4[" + j + "," + i + "].Value";
while (ppt.GetValueOfPrimaryDataSource() == null)
{
// do nothing
}
myRow[j]= ppt.GetValueOfPrimaryDataSource();
}
dataTable.Rows.Add(myRow);
}
grid.DataSource = dataTable;
Let us look at the code closely. First, we obtain the process point we created earlier and put it into a variable called “ppt”. We also obtain the DataGridView control from the display and put that into the variable “wfctl”. Within this control is the grid or table object that we want to fill with data. Therefore, we defined the variable “gird” and assigned it the table object.
In order to fill “grid” with data, we need to customize a table and fill it with the data provided in the process point. We created columns (omitted from the code snippet).
NOTE: You can add columns by using the Columns.Add method. For more information about available methods and properties for a DataTable, please refer to the Microsoft documentation.
In the for-loop, we add a row to our table each time and we construct the data source to get us the value of the process point. Once we have loop through and gotten all of our values into our custom table, we can set that as the grid’s data source to display.
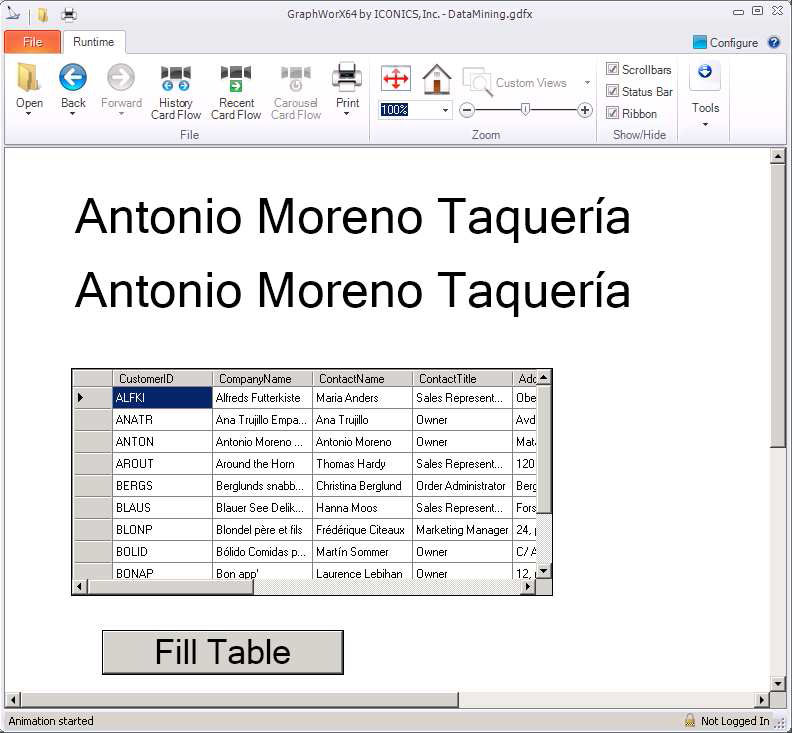
The figure below shows a GraphWorX64 display with the end results. The first process point you see is the result from our first OPC tag returning a single value. The second process point uses the extended tag syntax to get the value in a two dimensional array. And in the DataGridView control, we see the results of running the code snippet we used.
Finished Display