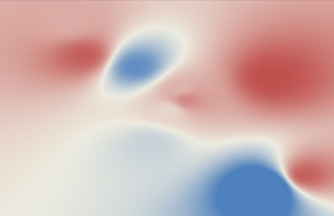
The weighted average function of the heatmap gives the heatmap a more natural-looking and smooth transition between data points. This works particularly well for a temperature heatmap.
Heatmap Example 1
Open GraphWorX64.
Go to Controls.
Add a heatmap to your display.
Configure the heatmap.
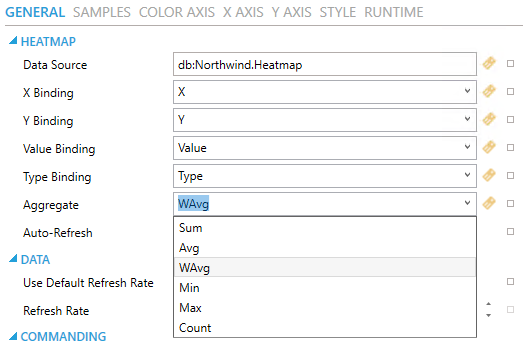
On the General page in the Heatmap section, choose WAvg for the aggregate.
Select WAVg for Aggregate
Go to the Samples page and set the Minimal Value.
The minimal value defines the “size” of each point, or how far the color from that point should bleed into the surroundings. This affects both the time to load the heatmap and how smooth the heatmap appears.
A minimal value of zero provides the smoothest, most expected results, however it takes up a lot of resources. The minimal value should be as large as possible while still producing an acceptable visual. The best visuals have significant or complete overlap between circles.
The simple way to estimate a good minimal value is to set it to the approximate number of data points the report puts on the screen divided by 10,000. If it does not look smooth enough, make the number smaller. If it takes a long time to load, make the number bigger.
More precisely, the minimum value is the inverse of the radius of each point squared. The optimal radius will depend on the distribution and uniformity of the data as well as the performance needs of the report.
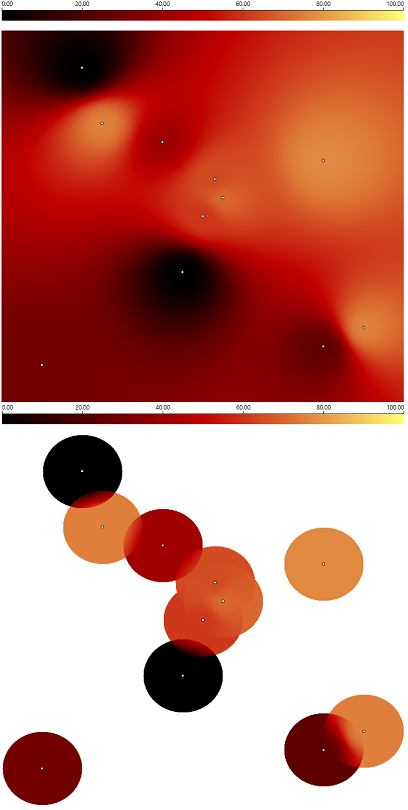
To help illustrate this, the two heatmaps below are using the same dataset, but the top heatmap has a minimal value of zero and the bottom heatmap has a minimal value of 0.001. The dataset only contains 11 points scattered somewhat far apart, so a minimal value of zero makes for the best view.
Heatmap Example 2
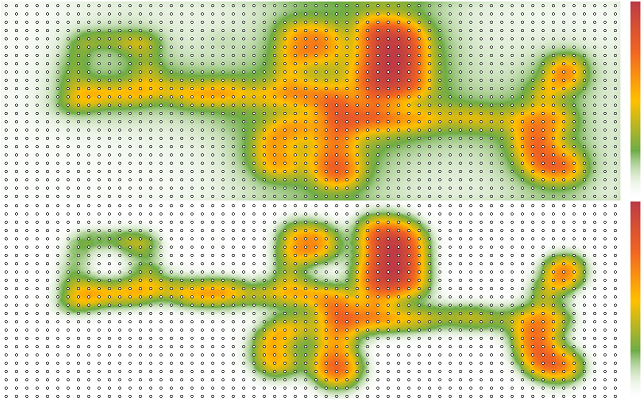
However, this next dataset contains enough samples to fully cover the entire heatmap in a grid. The top heatmap has a minimal value of 0, whereas the bottom heatmap has a minimal value of 0.1. As you can see, there is not as much difference between the two images. With this well-populated dataset, a minimal value of 0.1 can be visually acceptable and provides better performance than 0.
Heatmap Example 3
See Also: